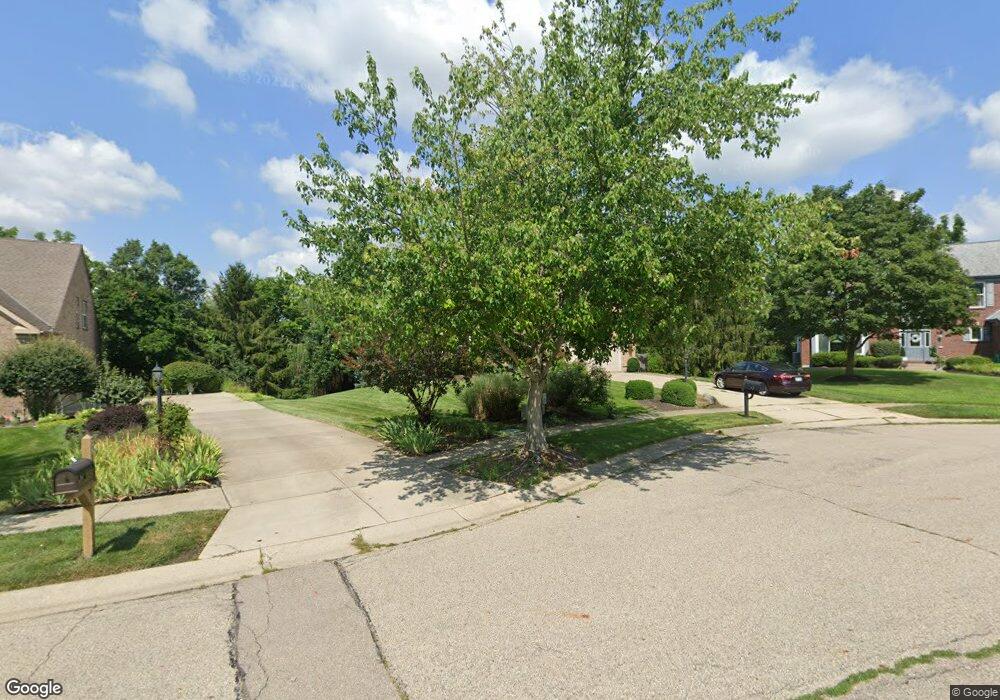
35 Millers Row Springboro, OH 45066
Estimated Value: $511,000 - $603,000
4
Beds
4
Baths
2,672
Sq Ft
$206/Sq Ft
Est. Value
About This Home
This home is located at 35 Millers Row, Springboro, OH 45066 and is currently estimated at $550,573, approximately $206 per square foot. 35 Millers Row is a home located in Warren County with nearby schools including Clearcreek Elementary School, Springboro Intermediate School, and Springboro Junior High School.
Ownership History
Date
Name
Owned For
Owner Type
Purchase Details
Closed on
Jul 6, 2016
Sold by
Herbenick Wendy S and Herbenick Michael
Bought by
Monzon Armando and Monzon Stephanie N
Current Estimated Value
Purchase Details
Closed on
Jun 8, 2009
Sold by
Peltier Jeffrey A and Peltier Jeanne E
Bought by
Stamas Wendy S
Home Financials for this Owner
Home Financials are based on the most recent Mortgage that was taken out on this home.
Original Mortgage
$238,552
Interest Rate
4.92%
Mortgage Type
FHA
Purchase Details
Closed on
Dec 24, 1996
Sold by
N V R Homes Inc
Bought by
Peltier Jeffrey A and Peltier Jeanne E
Home Financials for this Owner
Home Financials are based on the most recent Mortgage that was taken out on this home.
Original Mortgage
$207,000
Interest Rate
7.74%
Mortgage Type
New Conventional
Purchase Details
Closed on
Jun 18, 1996
Sold by
Coffman Dev Co Inc
Bought by
Nvr Homes Inc
Create a Home Valuation Report for This Property
The Home Valuation Report is an in-depth analysis detailing your home's value as well as a comparison with similar homes in the area
Home Values in the Area
Average Home Value in this Area
Purchase History
| Date | Buyer | Sale Price | Title Company |
|---|---|---|---|
| Monzon Armando | $364,000 | Attorney | |
| Stamas Wendy S | $243,000 | Home Services Title | |
| Peltier Jeffrey A | $230,010 | -- | |
| Nvr Homes Inc | $51,900 | -- |
Source: Public Records
Mortgage History
| Date | Status | Borrower | Loan Amount |
|---|---|---|---|
| Previous Owner | Stamas Wendy S | $238,552 | |
| Previous Owner | Peltier Jeffrey A | $207,000 |
Source: Public Records
Tax History
| Year | Tax Paid | Tax Assessment Tax Assessment Total Assessment is a certain percentage of the fair market value that is determined by local assessors to be the total taxable value of land and additions on the property. | Land | Improvement |
|---|---|---|---|---|
| 2025 | $6,164 | $157,850 | $42,000 | $115,850 |
| 2024 | $6,164 | $157,850 | $42,000 | $115,850 |
| 2023 | $5,069 | $119,028 | $20,650 | $98,378 |
| 2022 | $4,994 | $119,028 | $20,650 | $98,378 |
| 2021 | $4,648 | $119,028 | $20,650 | $98,378 |
| 2020 | $4,505 | $100,870 | $17,500 | $83,370 |
| 2019 | $4,154 | $100,870 | $17,500 | $83,370 |
| 2018 | $4,157 | $100,870 | $17,500 | $83,370 |
| 2017 | $3,904 | $85,348 | $15,054 | $70,294 |
| 2016 | $4,072 | $85,348 | $15,054 | $70,294 |
| 2015 | $4,081 | $85,348 | $15,054 | $70,294 |
| 2014 | $4,183 | $82,860 | $14,620 | $68,250 |
| 2013 | $4,180 | $99,210 | $17,500 | $81,710 |
Source: Public Records
Map
Nearby Homes
- 50 Millard Ct
- 1101 Parklake Row
- 92 Villa Pointe Dr Unit 92
- 20 Terradyne Trace
- 1315 Woodland Greens Blvd
- 85 Meadows Dr
- 25 Glass Ct
- 80 Gregg Ct
- 23 Pheasant Run Cir Unit 9A
- 25 Blose Ct
- 510 Royal Springs Dr
- 365 Crockett Dr
- 86 Ed Knoll Bend
- 45 Ed Knoll Bend
- 1785 Archerfield Place
- 340 Saint James Place
- 230 Stanton Dr
- 195 Oasis Ct
- 76 Royal Birkdale
- 143 Timberside Ct
- 25 Millers Row
- 45 Millers Row
- 15 Millers Row
- 40 Millers Row
- 20 Millers Row
- 10 Millers Row
- 30 Millers Row
- 40 Blackford Dr
- 5 Millers Row
- 15 Easton Ct
- 60 Blackford Dr
- 25 Easton Ct
- 25 Blackford Dr
- 45 Blackford Dr
- 5 Easton Ct
- 65 Blackford Dr
- 30 Easton Ct
- 5 Springhouse Dr
- 75 Blackford Dr
- 40 Springhouse Dr
Your Personal Tour Guide
Ask me questions while you tour the home.