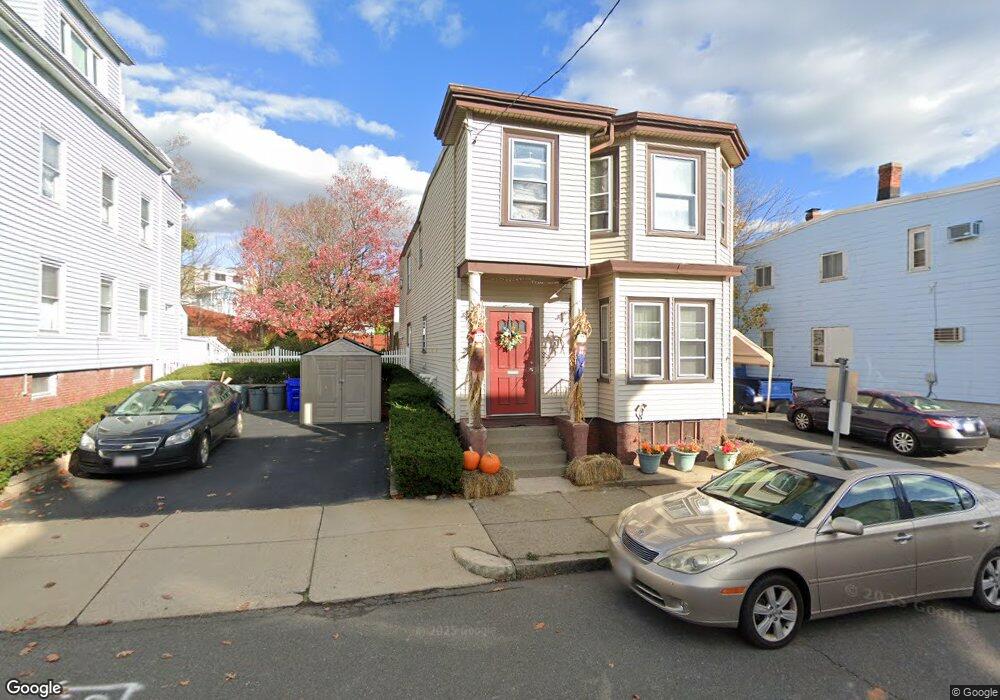
35 Moore St Boston, MA 02128
Harbor View-Orient Heights NeighborhoodEstimated Value: $856,000 - $1,073,002
5
Beds
2
Baths
2,418
Sq Ft
$389/Sq Ft
Est. Value
About This Home
This home is located at 35 Moore St, Boston, MA 02128 and is currently estimated at $939,501, approximately $388 per square foot. 35 Moore St is a home located in Suffolk County with nearby schools including Excel Academy East Boston, Brooke Charter Schools East Boston, and East Boston Montessori School.
Ownership History
Date
Name
Owned For
Owner Type
Purchase Details
Closed on
Sep 27, 2024
Sold by
Tirrone Joseph P and Tirrone Matyanne
Bought by
Tirrone Ft and Tirrone
Current Estimated Value
Purchase Details
Closed on
Feb 18, 2004
Sold by
Swan Michelle and Swan Malcom
Bought by
Tirone Joseph Paul
Home Financials for this Owner
Home Financials are based on the most recent Mortgage that was taken out on this home.
Original Mortgage
$300,000
Interest Rate
5.65%
Purchase Details
Closed on
Nov 9, 2000
Sold by
Deluca Mario and Deluca Antonietta
Bought by
Swan Michele and Swan Malcolm
Home Financials for this Owner
Home Financials are based on the most recent Mortgage that was taken out on this home.
Original Mortgage
$251,637
Interest Rate
7.81%
Mortgage Type
Purchase Money Mortgage
Create a Home Valuation Report for This Property
The Home Valuation Report is an in-depth analysis detailing your home's value as well as a comparison with similar homes in the area
Home Values in the Area
Average Home Value in this Area
Purchase History
| Date | Buyer | Sale Price | Title Company |
|---|---|---|---|
| Tirrone Ft | -- | None Available | |
| Tirrone Ft | -- | None Available | |
| Tirone Joseph Paul | $364,000 | -- | |
| Tirone Joseph Paul | $364,000 | -- | |
| Swan Michele | $260,000 | -- | |
| Swan Michele | $260,000 | -- |
Source: Public Records
Mortgage History
| Date | Status | Borrower | Loan Amount |
|---|---|---|---|
| Previous Owner | Swan Michele | $300,000 | |
| Previous Owner | Swan Michele | $251,637 |
Source: Public Records
Tax History
| Year | Tax Paid | Tax Assessment Tax Assessment Total Assessment is a certain percentage of the fair market value that is determined by local assessors to be the total taxable value of land and additions on the property. | Land | Improvement |
|---|---|---|---|---|
| 2025 | $10,365 | $895,100 | $360,900 | $534,200 |
| 2024 | $9,230 | $846,800 | $270,200 | $576,600 |
| 2023 | $8,663 | $806,600 | $257,400 | $549,200 |
| 2022 | $8,199 | $753,600 | $240,500 | $513,100 |
| 2021 | $7,658 | $717,700 | $229,000 | $488,700 |
| 2020 | $6,752 | $639,400 | $227,800 | $411,600 |
| 2019 | $6,154 | $583,900 | $165,300 | $418,600 |
| 2018 | $5,563 | $530,800 | $165,300 | $365,500 |
| 2017 | $5,110 | $482,500 | $165,300 | $317,200 |
| 2016 | $4,826 | $438,700 | $165,300 | $273,400 |
| 2015 | $4,357 | $359,800 | $136,600 | $223,200 |
| 2014 | $3,968 | $315,400 | $136,600 | $178,800 |
Source: Public Records
Map
Nearby Homes
- 58 Byron St Unit 3
- 10 Wordsworth St
- 43 Wordsworth St Unit 2
- 95 Addison St Unit PH8
- 95 Addison St Unit 102
- 95 Addison St Unit PH10
- 125 Addison St Unit 206
- 656 Saratoga St Unit 207
- 656 Saratoga St Unit 313
- 512 Bennington St
- 661 Bennington St Unit 3
- 198 Byron St
- 443 Bennington & 430 Frankfort St
- 130 Coleridge St Unit 6
- 130 Coleridge St Unit 1
- 136 Coleridge St
- 873 Saratoga St
- 176 Coleridge St
- 165 Cottage St Unit 706
- 165 Cottage St Unit 611
- 31 Moore St
- 39 Moore St
- 726 Saratoga St
- 726 Saratoga St Unit 3
- 27 Moore St
- 722 Saratoga St
- 722 Saratoga St
- 722 Saratoga St Unit 2
- 722 Saratoga St Unit 1
- 722 Saratoga St Unit 3
- 714 Saratoga St Unit 716
- 724 Saratoga St
- 724 Saratoga St Unit 1
- 724 Saratoga St Unit 3
- 718 Saratoga St Unit 720
- 718 Saratoga St Unit 3
- 728 Saratoga St
- 716 Saratoga St Unit 1
- 716 Saratoga St
- 28 Moore St Unit 1
Your Personal Tour Guide
Ask me questions while you tour the home.