
Landlord's Agent in 2012
Peter Thompson
Keller Williams Realty-Merrimack
(978) 844-0188
4 in this area
36 Total Sales


Estimated Value: $723,055 - $769,000
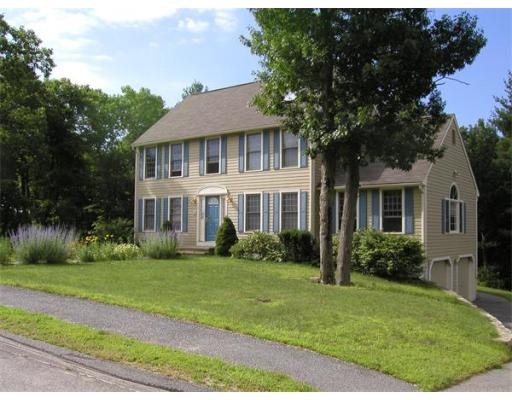
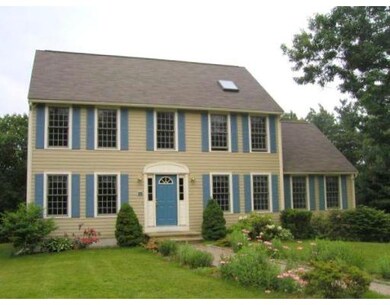
3 BR Colonial with a 2 car garage and central AC in an excellent neighborhood of similar homes. This house also has a large family room, partially finished basement and a finished third level. A level back yard with a large play set / playground gives you lots of space to play. Also included in this rental is the use of two refrigerators, a washer and a dryer. Available for occupancy on June 17, 2012.
Last Agent to Rent the Property
Keller Williams Realty-Merrimack Listed on: 05/04/2012
Last Renter's Agent
Christiana Santiago
Coldwell Banker Realty - Leominster
Home Type
Other
Year Built
1994
Lot Details
1.01 Acres
| Date | Buyer | Sale Price | Title Company |
|---|---|---|---|
| Dancer Lynne | $365,000 | -- | |
| Xiong Ping | $389,900 | -- |
| Date | Status | Borrower | Loan Amount |
|---|---|---|---|
| Open | Dancer Lynne | $402,828 |
| Date | Event | Price | List to Sale | Price per Sq Ft |
|---|---|---|---|---|
| 06/05/2012 06/05/12 | Rented | $1,795 | 0.0% | -- |
| 05/06/2012 05/06/12 | Under Contract | -- | -- | -- |
| 05/04/2012 05/04/12 | For Rent | $1,795 | -- | -- |
| Year | Tax Paid | Tax Assessment Tax Assessment Total Assessment is a certain percentage of the fair market value that is determined by local assessors to be the total taxable value of land and additions on the property. | Land | Improvement |
|---|---|---|---|---|
| 2025 | $7,146 | $597,500 | $189,900 | $407,600 |
| 2024 | $6,844 | $558,700 | $189,900 | $368,800 |
| 2023 | $6,566 | $528,700 | $189,900 | $338,800 |
| 2022 | $6,365 | $474,300 | $165,100 | $309,200 |
| 2021 | $6,322 | $447,100 | $156,100 | $291,000 |
| 2020 | $5,995 | $425,200 | $150,100 | $275,100 |
| 2019 | $5,641 | $413,900 | $143,000 | $270,900 |
| 2018 | $7,046 | $409,800 | $138,800 | $271,000 |
| 2017 | $5,614 | $390,100 | $134,800 | $255,300 |
| 2016 | $5,383 | $370,500 | $131,000 | $239,500 |
| 2015 | $5,355 | $366,300 | $131,000 | $235,300 |
| 2014 | $5,098 | $362,100 | $131,000 | $231,100 |
Landlord's Agent in 2012
Peter Thompson
Keller Williams Realty-Merrimack
(978) 844-0188
4 in this area
36 Total Sales
C
Tenant's Agent in 2012
Christiana Santiago
Coldwell Banker Realty - Leominster
Source: MLS Property Information Network (MLS PIN)
MLS Number: 71378241
APN: AYER-000016-000000-000031
Disclaimer: Certain information contained herein is derived from information provided by parties other than Homes.com. All information provided is deemed reliable, but is not guaranteed to be accurate and should be independently verified.
![]() The property listing data and information, or the Images, set forth herein were provided to MLS Property Information Network, Inc. from third party sources, including sellers, lessors and public records, and were compiled by MLS Property Information Network, Inc. The property listing data and information, and the Images, are for the personal, non-commercial use of consumers having a good faith interest in purchasing or leasing listed properties of the type displayed to them and may not be used for any purpose other than to identify prospective properties which such consumers may have a good faith interest in purchasing or leasing. MLS Property Information Network, Inc. and its subscribers disclaim any and all representations and warranties as to the accuracy of the property listing data and information, or as to the accuracy of any of the Images, set forth herein.
The property listing data and information, or the Images, set forth herein were provided to MLS Property Information Network, Inc. from third party sources, including sellers, lessors and public records, and were compiled by MLS Property Information Network, Inc. The property listing data and information, and the Images, are for the personal, non-commercial use of consumers having a good faith interest in purchasing or leasing listed properties of the type displayed to them and may not be used for any purpose other than to identify prospective properties which such consumers may have a good faith interest in purchasing or leasing. MLS Property Information Network, Inc. and its subscribers disclaim any and all representations and warranties as to the accuracy of the property listing data and information, or as to the accuracy of any of the Images, set forth herein.
Ask me questions while you tour the home.