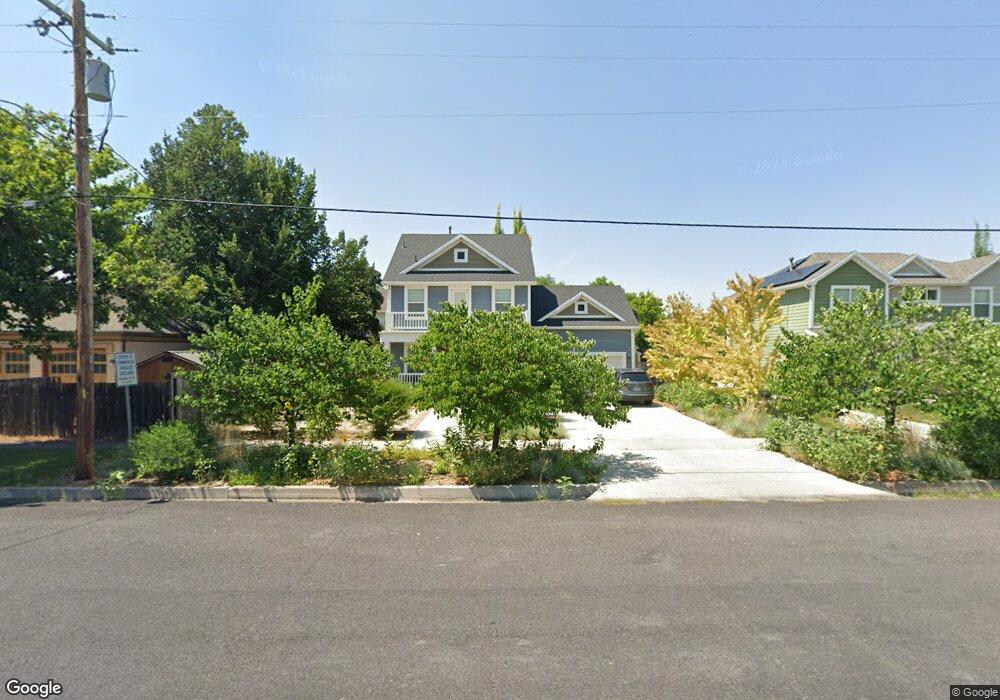
35 N 200 W Logan, UT 84321
Ellis NeighborhoodEstimated Value: $459,498 - $637,000
4
Beds
3
Baths
2,815
Sq Ft
$191/Sq Ft
Est. Value
About This Home
This home is located at 35 N 200 W, Logan, UT 84321 and is currently estimated at $536,875, approximately $190 per square foot. 35 N 200 W is a home located in Cache County with nearby schools including Ellis School, Mount Logan Middle School, and Logan High School.
Ownership History
Date
Name
Owned For
Owner Type
Purchase Details
Closed on
Jul 16, 2015
Sold by
Needham Joseph and Needham Jenilyn
Bought by
Larese Casanova Mark and Odum Amy L
Current Estimated Value
Home Financials for this Owner
Home Financials are based on the most recent Mortgage that was taken out on this home.
Original Mortgage
$212,000
Outstanding Balance
$80,741
Interest Rate
3.85%
Mortgage Type
New Conventional
Estimated Equity
$456,134
Create a Home Valuation Report for This Property
The Home Valuation Report is an in-depth analysis detailing your home's value as well as a comparison with similar homes in the area
Home Values in the Area
Average Home Value in this Area
Purchase History
| Date | Buyer | Sale Price | Title Company |
|---|---|---|---|
| Larese Casanova Mark | -- | Cache Title Logan |
Source: Public Records
Mortgage History
| Date | Status | Borrower | Loan Amount |
|---|---|---|---|
| Open | Larese Casanova Mark | $212,000 |
Source: Public Records
Tax History Compared to Growth
Tax History
| Year | Tax Paid | Tax Assessment Tax Assessment Total Assessment is a certain percentage of the fair market value that is determined by local assessors to be the total taxable value of land and additions on the property. | Land | Improvement |
|---|---|---|---|---|
| 2025 | $1,943 | $251,320 | $0 | $0 |
| 2024 | $2,011 | $251,895 | $0 | $0 |
| 2023 | $2,088 | $249,315 | $0 | $0 |
| 2022 | $2,236 | $249,315 | $0 | $0 |
| 2021 | $2,103 | $362,248 | $42,000 | $320,248 |
| 2020 | $2,067 | $320,477 | $42,000 | $278,477 |
| 2019 | $2,161 | $320,476 | $42,000 | $278,476 |
| 2018 | $2,146 | $290,640 | $42,000 | $248,640 |
| 2017 | $2,142 | $153,340 | $0 | $0 |
| 2016 | $2,220 | $151,635 | $0 | $0 |
| 2015 | $464 | $32,000 | $0 | $0 |
Source: Public Records
Map
Nearby Homes