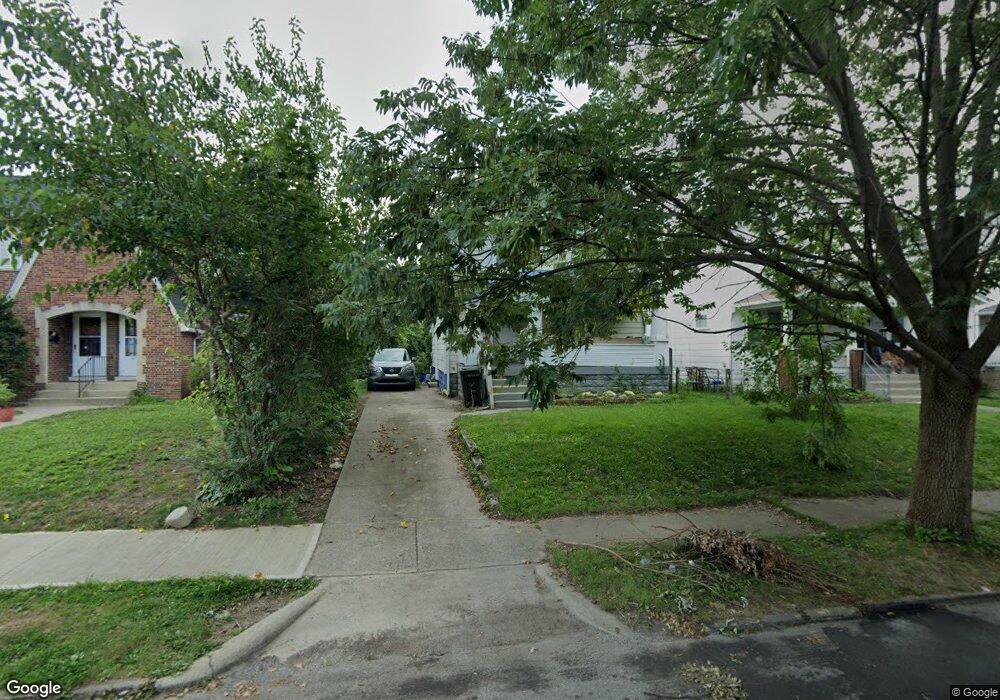
35 N Huron Ave Columbus, OH 43204
North Hilltop NeighborhoodEstimated Value: $168,291 - $204,000
3
Beds
1
Bath
1,248
Sq Ft
$152/Sq Ft
Est. Value
About This Home
This home is located at 35 N Huron Ave, Columbus, OH 43204 and is currently estimated at $189,573, approximately $151 per square foot. 35 N Huron Ave is a home located in Franklin County with nearby schools including West Broad Elementary School, Westmoor Middle School, and West High School.
Ownership History
Date
Name
Owned For
Owner Type
Purchase Details
Closed on
Jan 30, 2020
Sold by
Equity Creation Llc
Bought by
Ec6 Llc
Current Estimated Value
Purchase Details
Closed on
Apr 15, 2019
Sold by
Ditech Financial Llc
Bought by
Equity Creation Llc
Purchase Details
Closed on
Mar 20, 2019
Sold by
Dodson Michael E
Bought by
Ditech Financial Llc and Green Tree Servicing Llc
Purchase Details
Closed on
Jan 3, 2012
Sold by
Erwin Rhonda P and Dodson Rhonda P
Bought by
Dodson Michaerl F
Purchase Details
Closed on
Jul 3, 2001
Sold by
Dolan J Communication Inc
Bought by
Siers Andrew N and Siers Sandra C
Purchase Details
Closed on
May 10, 1994
Bought by
Dolan J Communication Inc
Purchase Details
Closed on
Sep 22, 1992
Purchase Details
Closed on
Jun 23, 1989
Create a Home Valuation Report for This Property
The Home Valuation Report is an in-depth analysis detailing your home's value as well as a comparison with similar homes in the area
Home Values in the Area
Average Home Value in this Area
Purchase History
| Date | Buyer | Sale Price | Title Company |
|---|---|---|---|
| Ec6 Llc | -- | None Available | |
| Equity Creation Llc | $37,280 | Servicelink | |
| Ditech Financial Llc | $68,000 | None Available | |
| Dodson Michaerl F | -- | Attorney | |
| Siers Andrew N | $44,000 | Amerititle Mill Run | |
| Dolan J Communication Inc | $50,000 | -- | |
| -- | -- | -- | |
| -- | $49,900 | -- |
Source: Public Records
Tax History Compared to Growth
Tax History
| Year | Tax Paid | Tax Assessment Tax Assessment Total Assessment is a certain percentage of the fair market value that is determined by local assessors to be the total taxable value of land and additions on the property. | Land | Improvement |
|---|---|---|---|---|
| 2024 | $3,456 | $50,480 | $8,510 | $41,970 |
| 2023 | $2,285 | $50,470 | $8,505 | $41,965 |
| 2022 | $2,214 | $41,660 | $7,250 | $34,410 |
| 2021 | $2,259 | $41,660 | $7,250 | $34,410 |
| 2020 | $2,257 | $41,660 | $7,250 | $34,410 |
| 2019 | $2,041 | $33,640 | $6,060 | $27,580 |
| 2018 | $2,006 | $33,640 | $6,060 | $27,580 |
| 2017 | $2,168 | $33,640 | $6,060 | $27,580 |
| 2016 | $2,138 | $29,330 | $6,510 | $22,820 |
| 2015 | $1,914 | $29,330 | $6,510 | $22,820 |
| 2014 | $1,768 | $29,330 | $6,510 | $22,820 |
| 2013 | $1,042 | $32,585 | $7,245 | $25,340 |
Source: Public Records
Map
Nearby Homes
- 75 N Huron Ave
- 3096 Ellis Place
- 58 Binns Blvd
- 66 N Brinker Ave
- 154-156 N Huron Ave
- 119 N Westgate Ave
- 65 N Chase Ave
- 3100 Steele Ave
- 36-38 Orel Ave
- 113 N Brinker Ave Unit 115
- 32 Orel Ave
- 162 S Roys Ave
- 184 N Roys Ave
- 133 S Brinker Ave
- 160 N Sylvan Ave
- 180 N Sylvan Ave
- 65 S Hague Ave
- 104-106 N Hague Ave
- 79 S Southampton Ave
- 267 S Westgate Ave
- 41 N Huron Ave Unit 43
- 41 N Huron Ave
- 31 N Huron Ave
- 43 N Huron Ave
- 25-31 N Huron Ave
- 45-47 N Huron Ave
- 45 N Huron Ave Unit 47
- 51 N Huron Ave
- 55 N Huron Ave Unit 57
- 38 N Westmoor Ave Unit 40
- 46-48 N Westmoor Ave
- 26 N Westmoor Ave Unit 28
- 46 N Westmoor Ave Unit 48
- 61 & 63 N Huron Ave N Unit 3
- 52 N Westmoor Ave
- 61 N Huron Ave Unit 63
- 61 N Huron Ave
- 63 N Huron Ave Columbus Oh
- 61 N Huron Ave Unit 3
- 28 N Westmoor Ave