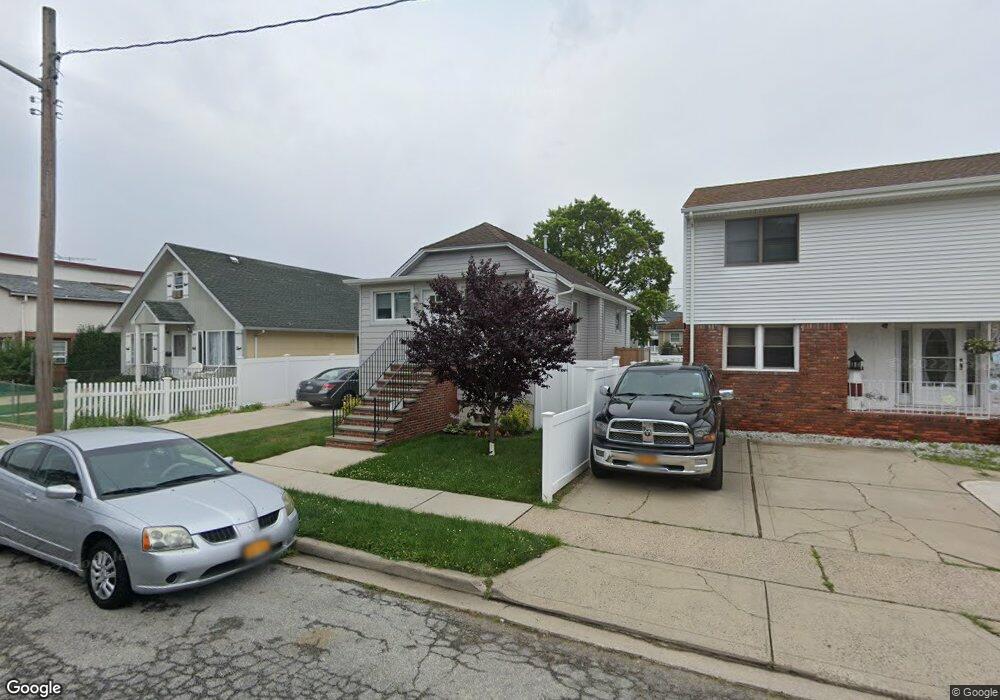
35 Newport Rd Island Park, NY 11558
Estimated Value: $508,378 - $529,000
2
Beds
1
Bath
779
Sq Ft
$666/Sq Ft
Est. Value
About This Home
This home is located at 35 Newport Rd, Island Park, NY 11558 and is currently estimated at $518,689, approximately $665 per square foot. 35 Newport Rd is a home located in Nassau County with nearby schools including Francis X Hegarty Elementary School, Lincoln Orens Middle School, and Hebrew Academy of Long Beach.
Ownership History
Date
Name
Owned For
Owner Type
Purchase Details
Closed on
Oct 25, 2016
Sold by
3Ms Llc
Bought by
Langenbach Robert A
Current Estimated Value
Home Financials for this Owner
Home Financials are based on the most recent Mortgage that was taken out on this home.
Original Mortgage
$260,000
Outstanding Balance
$208,735
Interest Rate
3.42%
Mortgage Type
New Conventional
Estimated Equity
$309,954
Purchase Details
Closed on
Feb 26, 2016
Sold by
Housing Trust Fund Corporation
Bought by
3Ms Llc
Purchase Details
Closed on
Mar 25, 2015
Sold by
Walsh Christina A and Walsh Steven A
Bought by
Housing Trust Fund Corp
Purchase Details
Closed on
Feb 12, 2008
Sold by
Walsh Steven
Purchase Details
Closed on
Feb 16, 2006
Sold by
Walsh Steven
Purchase Details
Closed on
May 11, 2000
Sold by
Bennett William
Bought by
Walsh Steven
Create a Home Valuation Report for This Property
The Home Valuation Report is an in-depth analysis detailing your home's value as well as a comparison with similar homes in the area
Home Values in the Area
Average Home Value in this Area
Purchase History
| Date | Buyer | Sale Price | Title Company |
|---|---|---|---|
| Langenbach Robert A | $327,500 | Judicial Title | |
| 3Ms Llc | $110,000 | None Available | |
| Housing Trust Fund Corp | $325,000 | Fidelity National | |
| -- | -- | -- | |
| -- | -- | -- | |
| Walsh Steven | $191,000 | Paul Kast |
Source: Public Records
Mortgage History
| Date | Status | Borrower | Loan Amount |
|---|---|---|---|
| Open | Langenbach Robert A | $260,000 |
Source: Public Records
Tax History Compared to Growth
Tax History
| Year | Tax Paid | Tax Assessment Tax Assessment Total Assessment is a certain percentage of the fair market value that is determined by local assessors to be the total taxable value of land and additions on the property. | Land | Improvement |
|---|---|---|---|---|
| 2025 | $6,681 | $317 | $142 | $175 |
| 2024 | $1,186 | $315 | $141 | $174 |
| 2023 | $4,868 | $312 | $140 | $172 |
| 2022 | $4,868 | $350 | $157 | $193 |
| 2021 | $6,900 | $349 | $156 | $193 |
| 2020 | $4,997 | $434 | $392 | $42 |
| 2019 | $4,413 | $513 | $484 | $29 |
| 2018 | $4,957 | $591 | $0 | $0 |
| 2017 | $0 | $591 | $538 | $53 |
| 2016 | -- | $591 | $538 | $53 |
| 2015 | $1,351 | $603 | $538 | $65 |
| 2014 | $1,351 | $603 | $538 | $65 |
| 2013 | $1,194 | $573 | $511 | $62 |
Source: Public Records
Map
Nearby Homes
- 35 Newport Rd
- 39 Newport Rd
- 4 Marina Rd
- 124 Nassau Ln
- 124 Nassau Ln Unit 2ND FL
- 6 Marina Rd
- 27 Newport Rd
- 34 Newport Rd
- 8 Marina Rd
- 25 Newport Rd
- 36 Newport Rd
- 36 Newport Rd
- 38 Newport Rd Unit Top Fl
- 38 Newport Rd Unit 1st Fl
- 38 Newport Rd
- 38 Newport Rd Unit 2
- 38 Newport Rd Unit Lower
- 38 Newport Rd Unit 3rd Fl
- 47 Newport Rd
- 47 Newport Rd Unit 2nd Fl