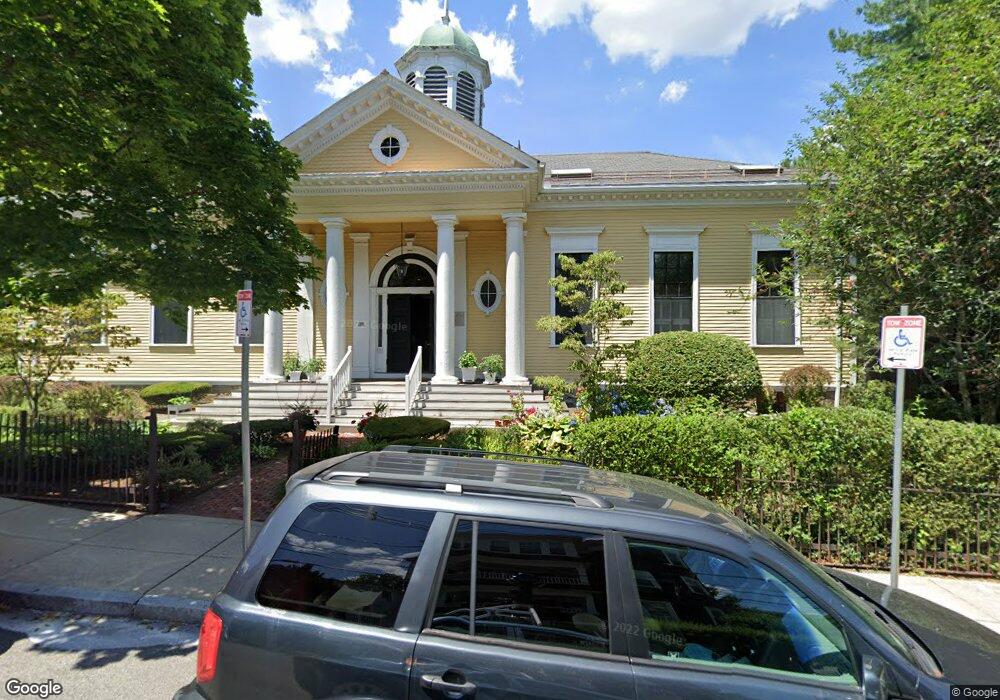
35 Nonantum St Unit C Brighton, MA 02135
Brighton NeighborhoodEstimated Value: $613,000 - $818,000
2
Beds
3
Baths
1,307
Sq Ft
$534/Sq Ft
Est. Value
About This Home
This home is located at 35 Nonantum St Unit C, Brighton, MA 02135 and is currently estimated at $698,152, approximately $534 per square foot. 35 Nonantum St Unit C is a home located in Suffolk County with nearby schools including St Columbkille Partnership School and Shaloh House Jewish Day School.
Ownership History
Date
Name
Owned For
Owner Type
Purchase Details
Closed on
Oct 1, 1997
Sold by
Sloane Todd C and Sloane Elizabeth A
Bought by
Shinobu Leslie A
Current Estimated Value
Home Financials for this Owner
Home Financials are based on the most recent Mortgage that was taken out on this home.
Original Mortgage
$180,000
Outstanding Balance
$28,818
Interest Rate
7.41%
Mortgage Type
Purchase Money Mortgage
Estimated Equity
$669,334
Purchase Details
Closed on
Mar 1, 1991
Sold by
Boucher Pamela B and Boucher Whitney S
Bought by
Sloane Todd C
Purchase Details
Closed on
Feb 2, 1990
Sold by
Nesbitt Naomi
Bought by
Boucher Whitney S
Home Financials for this Owner
Home Financials are based on the most recent Mortgage that was taken out on this home.
Original Mortgage
$143,200
Interest Rate
9.59%
Mortgage Type
Purchase Money Mortgage
Create a Home Valuation Report for This Property
The Home Valuation Report is an in-depth analysis detailing your home's value as well as a comparison with similar homes in the area
Home Values in the Area
Average Home Value in this Area
Purchase History
| Date | Buyer | Sale Price | Title Company |
|---|---|---|---|
| Shinobu Leslie A | $200,000 | -- | |
| Sloane Todd C | $182,500 | -- | |
| Boucher Whitney S | $179,000 | -- |
Source: Public Records
Mortgage History
| Date | Status | Borrower | Loan Amount |
|---|---|---|---|
| Open | Boucher Whitney S | $180,000 | |
| Previous Owner | Boucher Whitney S | $143,200 |
Source: Public Records
Tax History
| Year | Tax Paid | Tax Assessment Tax Assessment Total Assessment is a certain percentage of the fair market value that is determined by local assessors to be the total taxable value of land and additions on the property. | Land | Improvement |
|---|---|---|---|---|
| 2025 | $6,082 | $525,200 | $0 | $525,200 |
| 2024 | $5,994 | $549,900 | $0 | $549,900 |
| 2023 | $5,906 | $549,900 | $0 | $549,900 |
| 2022 | $5,698 | $523,700 | $0 | $523,700 |
| 2021 | $5,409 | $506,900 | $0 | $506,900 |
| 2020 | $5,304 | $502,300 | $0 | $502,300 |
| 2019 | $5,092 | $483,100 | $0 | $483,100 |
| 2018 | $4,845 | $462,300 | $0 | $462,300 |
| 2017 | $4,534 | $428,100 | $0 | $428,100 |
| 2016 | $4,485 | $407,700 | $0 | $407,700 |
| 2015 | $4,260 | $351,800 | $0 | $351,800 |
| 2014 | $4,019 | $319,500 | $0 | $319,500 |
Source: Public Records
Map
Nearby Homes
- 427-435 Faneuil St Unit R4
- 18 Breck Ave Unit 18
- 22 Bigelow St
- 19 Crescent Circuit Crescent S
- 96 Brayton Rd
- 27 S Crescent Circuit Crescent
- 99 Tremont St Unit 206
- 99 Tremont St Unit 105
- 99 Tremont St Unit 302
- 34 Larch St Unit 34
- 32 Larch St Unit 34
- 32-34 Larch St
- 21 Upcrest Rd
- 143 Tremont St Unit A
- 69 Presentation Rd
- 144 Newton St Unit 1
- 12 Mina Way
- 6-8 Cenacle Rd
- 116 Lake Shore Rd Unit 4
- 115 Bennett St Unit 1
- 35 Nonantum St Unit J
- 35 Nonantum St Unit I
- 35 Nonantum St Unit H
- 35 Nonantum St Unit G
- 35 Nonantum St Unit F
- 35 Nonantum St Unit D
- 35 Nonantum St Unit B
- 35 Nonantum St Unit A
- 43 Nonantum St
- 45 Nonantum St
- 45 Nonantum St Unit 2
- 16 Nonantum St Unit 1
- 16 Nonantum St
- 16 Nonantum St
- 16 Nonantum St Unit 3
- 16 Nonantum St Unit 2
- 26 Tremont St Unit 28
- 24 Tremont St
- 26 Tremont St Unit 1
- 24 Tremont St Unit 24
Your Personal Tour Guide
Ask me questions while you tour the home.