Estimated Value: $492,000 - $609,000
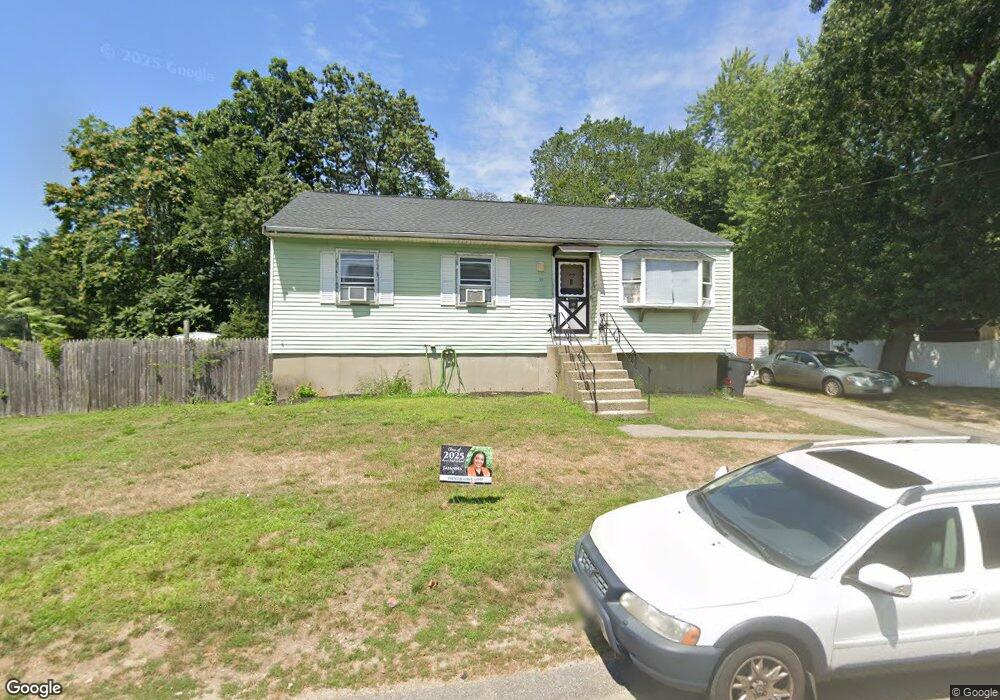
3
Beds
1
Bath
1,372
Sq Ft
$403/Sq Ft
Est. Value
About This Home
This home is located at 35 Oliver St, Avon, MA 02322 and is currently estimated at $552,715, approximately $402 per square foot. 35 Oliver St is a home located in Norfolk County with nearby schools including Ralph D. Butler Elementary School and Avon Middle/High School.
Ownership History
Date
Name
Owned For
Owner Type
Purchase Details
Closed on
Feb 15, 2024
Sold by
Niesen Samuel S and Niesen Amie R
Bought by
Niesen Amie R and Niesen Darah G
Current Estimated Value
Purchase Details
Closed on
Jun 1, 2023
Sold by
Niesen Samuel S
Bought by
Niesen Darah G and Niesen Amie R
Purchase Details
Closed on
Dec 6, 2022
Sold by
Niesen Samuel S and Niesen Wendy A
Bought by
Niesen Samuel S
Purchase Details
Closed on
Apr 12, 1985
Bought by
Niesen Samuel S and Niesen Wendy
Create a Home Valuation Report for This Property
The Home Valuation Report is an in-depth analysis detailing your home's value as well as a comparison with similar homes in the area
Home Values in the Area
Average Home Value in this Area
Purchase History
| Date | Buyer | Sale Price | Title Company |
|---|---|---|---|
| Niesen Amie R | -- | None Available | |
| Niesen Darah G | -- | None Available | |
| Niesen Samuel S | -- | None Available | |
| Niesen Samuel S | $85,900 | -- |
Source: Public Records
Tax History
| Year | Tax Paid | Tax Assessment Tax Assessment Total Assessment is a certain percentage of the fair market value that is determined by local assessors to be the total taxable value of land and additions on the property. | Land | Improvement |
|---|---|---|---|---|
| 2025 | $6,112 | $458,200 | $222,200 | $236,000 |
| 2024 | $5,564 | $396,600 | $201,500 | $195,100 |
| 2023 | $5,402 | $396,600 | $201,500 | $195,100 |
| 2022 | $5,478 | $346,500 | $168,000 | $178,500 |
| 2021 | $5,029 | $299,700 | $152,400 | $147,300 |
| 2020 | $5,393 | $304,700 | $149,600 | $155,100 |
| 2019 | $4,857 | $270,000 | $142,700 | $127,300 |
| 2018 | $4,949 | $266,800 | $142,700 | $124,100 |
| 2017 | $4,372 | $253,000 | $142,700 | $110,300 |
| 2016 | $4,322 | $252,600 | $135,900 | $116,700 |
| 2015 | $3,953 | $241,500 | $129,800 | $111,700 |
Source: Public Records
Map
Nearby Homes
Your Personal Tour Guide
Ask me questions while you tour the home.