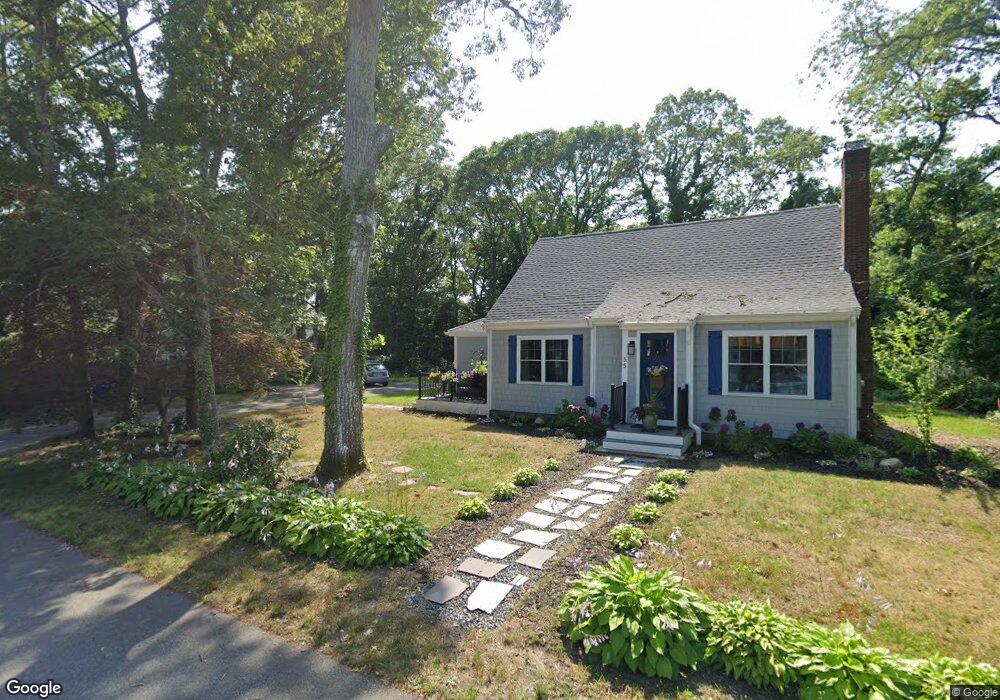
35 Olney Rd Bourne, MA 2532
Estimated Value: $634,000 - $808,000
3
Beds
3
Baths
1,642
Sq Ft
$456/Sq Ft
Est. Value
About This Home
This home is located at 35 Olney Rd, Bourne, MA 2532 and is currently estimated at $749,222, approximately $456 per square foot. 35 Olney Rd is a home located in Barnstable County with nearby schools including Bourne High School, St Margaret Regional School, and Cadence Academy Preschool - Bourne.
Ownership History
Date
Name
Owned For
Owner Type
Purchase Details
Closed on
Dec 18, 2023
Sold by
Soja Properties Llc
Bought by
Reilly Cynthia
Current Estimated Value
Home Financials for this Owner
Home Financials are based on the most recent Mortgage that was taken out on this home.
Original Mortgage
$559,000
Outstanding Balance
$546,381
Interest Rate
6.38%
Mortgage Type
Purchase Money Mortgage
Estimated Equity
$202,841
Purchase Details
Closed on
May 4, 2023
Sold by
Pilgrim Hill Holdings Llc
Bought by
Soja Properties Llc
Home Financials for this Owner
Home Financials are based on the most recent Mortgage that was taken out on this home.
Original Mortgage
$392,000
Interest Rate
6.42%
Mortgage Type
Commercial
Create a Home Valuation Report for This Property
The Home Valuation Report is an in-depth analysis detailing your home's value as well as a comparison with similar homes in the area
Purchase History
| Date | Buyer | Sale Price | Title Company |
|---|---|---|---|
| Reilly Cynthia | $699,000 | None Available | |
| Reilly Cynthia | $699,000 | None Available | |
| Soja Properties Llc | $365,000 | None Available | |
| Soja Properties Llc | $365,000 | None Available | |
| Pilgrim Hill Holdings Llc | $300,000 | None Available | |
| Pilgrim Hill Holdings Llc | $300,000 | None Available |
Source: Public Records
Mortgage History
| Date | Status | Borrower | Loan Amount |
|---|---|---|---|
| Open | Reilly Cynthia | $559,000 | |
| Closed | Reilly Cynthia | $559,000 | |
| Previous Owner | Soja Properties Llc | $392,000 |
Source: Public Records
Tax History
| Year | Tax Paid | Tax Assessment Tax Assessment Total Assessment is a certain percentage of the fair market value that is determined by local assessors to be the total taxable value of land and additions on the property. | Land | Improvement |
|---|---|---|---|---|
| 2025 | $4,944 | $633,000 | $248,600 | $384,400 |
| 2024 | $4,834 | $602,700 | $236,700 | $366,000 |
| 2023 | $3,961 | $449,600 | $209,500 | $240,100 |
| 2022 | $3,794 | $376,000 | $185,400 | $190,600 |
| 2021 | $3,685 | $342,200 | $168,700 | $173,500 |
| 2020 | $3,497 | $325,600 | $167,100 | $158,500 |
| 2019 | $3,524 | $335,300 | $185,700 | $149,600 |
| 2018 | $0 | $319,400 | $176,900 | $142,500 |
| 2017 | $3,257 | $316,200 | $175,200 | $141,000 |
| 2016 | $2,752 | $270,900 | $157,700 | $113,200 |
| 2015 | $2,492 | $247,500 | $134,300 | $113,200 |
Source: Public Records
Map
Nearby Homes
- 35 Benedict Rd
- 60 Bourne Neck Dr
- 5 Zoli Ln
- 46 Holt Rd Unit B
- 46 Holt Rd
- 203 County Rd
- 40-A Lafayette Ave
- 13 Laurel Hill Ct
- 4 Van Bummel Rd
- 44 Cotuit Rd
- 2 Applewood Ct
- 5 Sea Knoll Ct
- 56 Rip Van Winkle Way
- 60 Sandwich Rd
- 12 Turnberry Rd Unit 12
- 38 Old Bridge Rd
- 3 Honora Ln Unit 3
- 6 Honora Ct
- 4 Hollyhock Knoll Ct Unit 4
- 4 Hollyhock Knoll Ct Unit 4
Your Personal Tour Guide
Ask me questions while you tour the home.