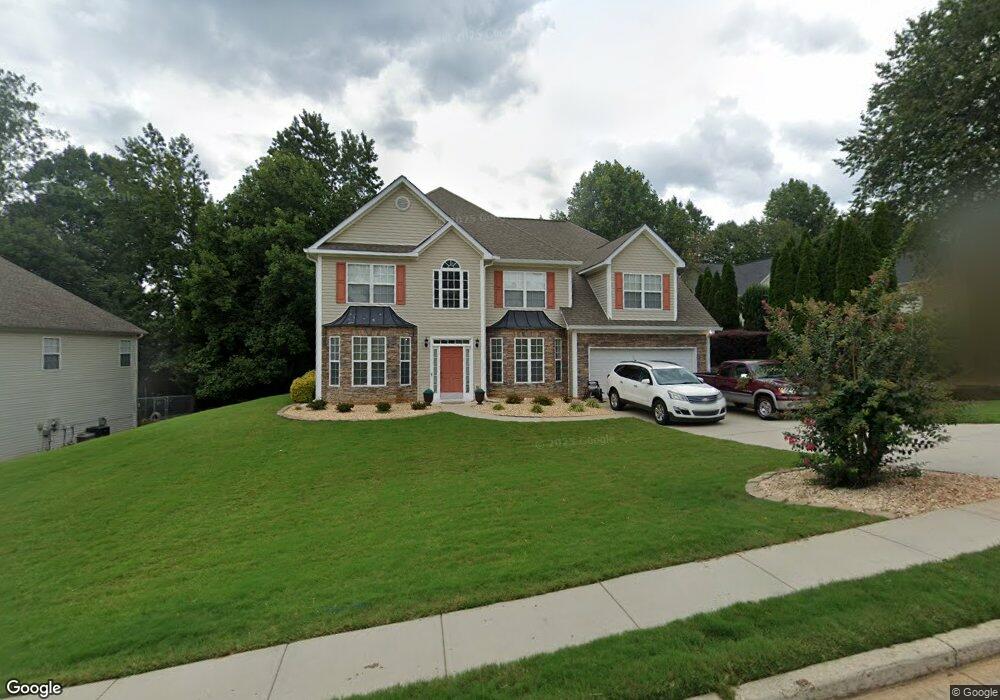
35 Parc Ct Covington, GA 30016
Estimated Value: $348,322 - $403,000
5
Beds
3
Baths
3,046
Sq Ft
$120/Sq Ft
Est. Value
About This Home
This home is located at 35 Parc Ct, Covington, GA 30016 and is currently estimated at $366,331, approximately $120 per square foot. 35 Parc Ct is a home located in Newton County with nearby schools including Newton County Theme School at Ficquett, Clements Middle School, and Newton High School.
Ownership History
Date
Name
Owned For
Owner Type
Purchase Details
Closed on
Jan 28, 2009
Sold by
Veterans Admn
Bought by
Dobbs Charlotte B
Current Estimated Value
Home Financials for this Owner
Home Financials are based on the most recent Mortgage that was taken out on this home.
Original Mortgage
$118,750
Outstanding Balance
$73,800
Interest Rate
5.03%
Mortgage Type
New Conventional
Estimated Equity
$292,531
Purchase Details
Closed on
Sep 2, 2008
Sold by
Wells Fargo Bank Na
Bought by
Veterans Admn
Purchase Details
Closed on
Jan 30, 2004
Sold by
Davis Roosevelt D
Bought by
Davis Roosevelt D and Davis Paula
Home Financials for this Owner
Home Financials are based on the most recent Mortgage that was taken out on this home.
Original Mortgage
$183,857
Interest Rate
5.77%
Mortgage Type
VA
Create a Home Valuation Report for This Property
The Home Valuation Report is an in-depth analysis detailing your home's value as well as a comparison with similar homes in the area
Home Values in the Area
Average Home Value in this Area
Purchase History
| Date | Buyer | Sale Price | Title Company |
|---|---|---|---|
| Dobbs Charlotte B | $125,000 | -- | |
| Veterans Admn | -- | -- | |
| Wells Fargo Bank Na | $150,702 | -- | |
| Davis Roosevelt D | -- | -- | |
| Davis Roosevelt D | $179,900 | -- |
Source: Public Records
Mortgage History
| Date | Status | Borrower | Loan Amount |
|---|---|---|---|
| Open | Dobbs Charlotte B | $118,750 | |
| Previous Owner | Davis Roosevelt D | $183,857 |
Source: Public Records
Tax History
| Year | Tax Paid | Tax Assessment Tax Assessment Total Assessment is a certain percentage of the fair market value that is determined by local assessors to be the total taxable value of land and additions on the property. | Land | Improvement |
|---|---|---|---|---|
| 2025 | $3,604 | $146,240 | $18,000 | $128,240 |
| 2024 | $3,831 | $152,720 | $18,000 | $134,720 |
| 2023 | $3,774 | $140,720 | $8,400 | $132,320 |
| 2022 | $3,160 | $118,080 | $8,400 | $109,680 |
| 2021 | $2,906 | $97,720 | $8,400 | $89,320 |
| 2020 | $3,062 | $93,280 | $8,400 | $84,880 |
| 2019 | $2,760 | $83,080 | $8,400 | $74,680 |
| 2018 | $2,440 | $73,240 | $8,400 | $64,840 |
| 2017 | $1,984 | $59,960 | $8,400 | $51,560 |
| 2016 | $2,011 | $60,760 | $9,200 | $51,560 |
| 2015 | $1,700 | $51,720 | $9,200 | $42,520 |
| 2014 | $1,489 | $39,640 | $0 | $0 |
Source: Public Records
Map
Nearby Homes
- 20 Fair Forest Terrace
- 3462 Fairview Rd
- 275 Fairview Chase Unit 1
- 100 Arlington Dr Unit 2
- 40 Princeton Ct
- 40 Quiet Water Ct
- 50 Evelyn Rd
- 2423 Access Rd
- 70 Camerons Way
- 35 Rolling Ridge Dr
- 30 Silver Peak Dr
- 90 Windsong Dr
- 215 Providence Pkwy
- 365 Silver Ridge Rd
- 63 Neely Hammonds Rd
- 445 Piedmont Cir
- 135 Flowers Dr
- 275 Hoglen Dr
- 2895 Fairview Rd
- 885 Almon Rd
Your Personal Tour Guide
Ask me questions while you tour the home.