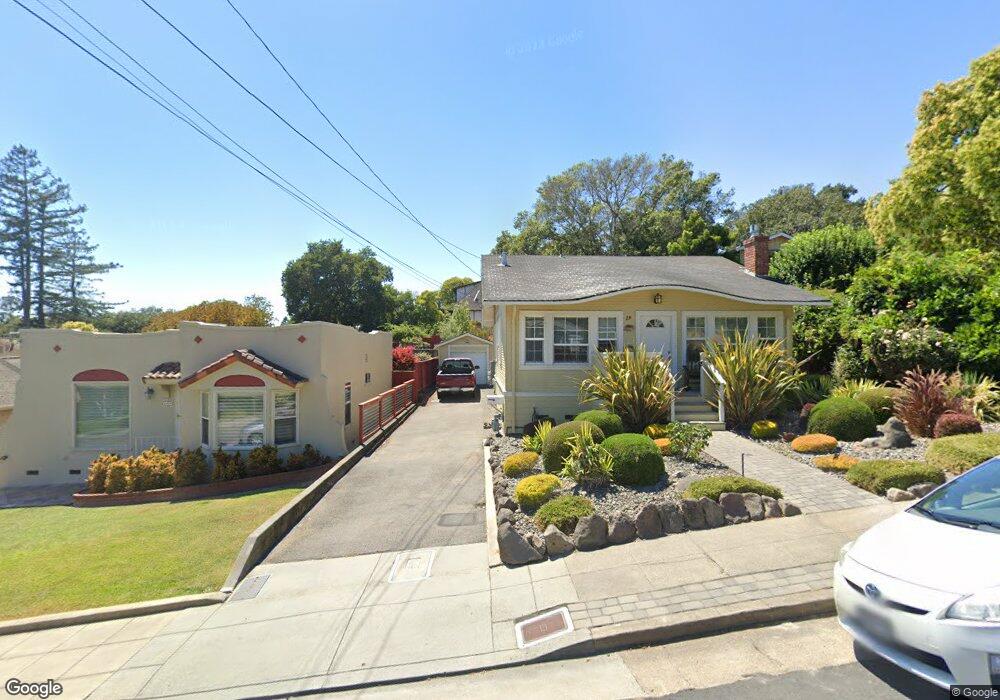
35 Park Ave Petaluma, CA 94952
Oakhill Brewster NeighborhoodEstimated Value: $1,102,000 - $1,202,000
3
Beds
2
Baths
2,180
Sq Ft
$530/Sq Ft
Est. Value
About This Home
This home is located at 35 Park Ave, Petaluma, CA 94952 and is currently estimated at $1,155,824, approximately $530 per square foot. 35 Park Ave is a home located in Sonoma County with nearby schools including Valley Vista Elementary School, Petaluma Junior High School, and Petaluma High School.
Ownership History
Date
Name
Owned For
Owner Type
Purchase Details
Closed on
May 1, 2007
Sold by
Loughran Suzanne S
Bought by
Loughran Suzanne S and The Suzanne S Loughran Revocab
Current Estimated Value
Purchase Details
Closed on
Jul 8, 2004
Sold by
Loughran William A and Loughran A W
Bought by
Loughran Suzanne S
Home Financials for this Owner
Home Financials are based on the most recent Mortgage that was taken out on this home.
Original Mortgage
$235,000
Interest Rate
5.75%
Mortgage Type
New Conventional
Create a Home Valuation Report for This Property
The Home Valuation Report is an in-depth analysis detailing your home's value as well as a comparison with similar homes in the area
Home Values in the Area
Average Home Value in this Area
Purchase History
We collect this data history from publicly available records. To have your information removed, we recommend requesting removal directly through your county’s website.
| Date | Buyer | Sale Price | Title Company |
|---|---|---|---|
| Loughran Suzanne S | -- | None Available | |
| Loughran Suzanne S | -- | Fidelity National Title Co |
Source: Public Records
Mortgage History
We collect this data history from publicly available records. To have your information removed, we recommend requesting removal directly through your county’s website.
| Date | Status | Borrower | Loan Amount |
|---|---|---|---|
| Closed | Loughran Suzanne S | $235,000 |
Source: Public Records
Tax History
| Year | Tax Paid | Tax Assessment Tax Assessment Total Assessment is a certain percentage of the fair market value that is determined by local assessors to be the total taxable value of land and additions on the property. | Land | Improvement |
|---|---|---|---|---|
| 2025 | $4,443 | $379,497 | $91,393 | $288,104 |
| 2024 | $4,148 | $372,056 | $89,601 | $282,455 |
| 2023 | $4,148 | $364,762 | $87,845 | $276,917 |
| 2022 | $3,976 | $357,611 | $86,123 | $271,488 |
| 2021 | $3,901 | $350,600 | $84,435 | $266,165 |
| 2020 | $3,933 | $347,006 | $83,570 | $263,436 |
| 2019 | $3,884 | $340,203 | $81,932 | $258,271 |
| 2018 | $3,868 | $333,533 | $80,326 | $253,207 |
| 2017 | $3,787 | $326,994 | $78,751 | $248,243 |
| 2016 | $3,693 | $320,583 | $77,207 | $243,376 |
| 2015 | -- | $315,769 | $76,048 | $239,721 |
| 2014 | -- | $309,585 | $74,559 | $235,026 |
Source: Public Records
Map
Nearby Homes
Your Personal Tour Guide
Ask me questions while you tour the home.