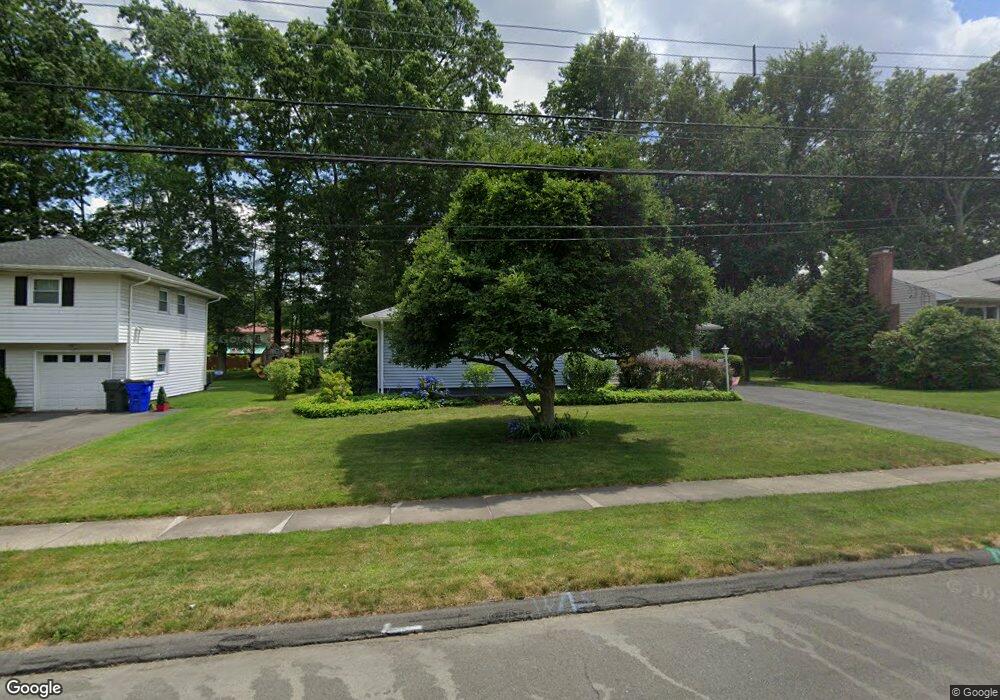
35 Parsons Dr West Hartford, CT 06117
Estimated Value: $524,000 - $579,000
3
Beds
3
Baths
1,861
Sq Ft
$297/Sq Ft
Est. Value
About This Home
This home is located at 35 Parsons Dr, West Hartford, CT 06117 and is currently estimated at $552,873, approximately $297 per square foot. 35 Parsons Dr is a home located in Hartford County with nearby schools including Aiken School, King Philip Middle School, and Delta High School.
Ownership History
Date
Name
Owned For
Owner Type
Purchase Details
Closed on
Aug 15, 2002
Sold by
White Irving Joseph and White Elaine G
Bought by
Nelson Michael S and Nelson Patricia A
Current Estimated Value
Create a Home Valuation Report for This Property
The Home Valuation Report is an in-depth analysis detailing your home's value as well as a comparison with similar homes in the area
Home Values in the Area
Average Home Value in this Area
Purchase History
| Date | Buyer | Sale Price | Title Company |
|---|---|---|---|
| Nelson Michael S | $249,000 | -- |
Source: Public Records
Mortgage History
| Date | Status | Borrower | Loan Amount |
|---|---|---|---|
| Previous Owner | Nelson Michael S | $13,500 | |
| Previous Owner | Nelson Michael S | $60,000 |
Source: Public Records
Tax History Compared to Growth
Tax History
| Year | Tax Paid | Tax Assessment Tax Assessment Total Assessment is a certain percentage of the fair market value that is determined by local assessors to be the total taxable value of land and additions on the property. | Land | Improvement |
|---|---|---|---|---|
| 2025 | $10,695 | $238,840 | $77,910 | $160,930 |
| 2024 | $10,115 | $238,840 | $77,910 | $160,930 |
| 2023 | $9,094 | $222,250 | $77,910 | $144,340 |
| 2022 | $9,041 | $222,250 | $77,910 | $144,340 |
| 2021 | $8,308 | $195,860 | $70,140 | $125,720 |
| 2020 | $7,906 | $189,140 | $62,370 | $126,770 |
| 2019 | $7,906 | $189,140 | $62,370 | $126,770 |
| 2018 | $7,755 | $189,140 | $62,370 | $126,770 |
| 2017 | $7,762 | $189,140 | $62,370 | $126,770 |
| 2016 | $6,790 | $171,850 | $56,490 | $115,360 |
| 2015 | $6,584 | $171,850 | $56,490 | $115,360 |
| 2014 | $6,422 | $171,850 | $56,490 | $115,360 |
Source: Public Records
Map
Nearby Homes
- 148 King Philip Dr
- 139 Mohawk Dr
- 9 Timberwood Rd
- 3 Pilgrim Rd
- 2 Croydon Dr
- 30 Farmstead Ln
- 11 Lawler Rd
- 50 Magnolia Hill
- 320 N Steele Rd
- 11 Rye Ridge Pkwy
- 1993 Albany Ave
- 115 Northbrook Dr
- 2581 Albany Ave
- 645 Bloomfield Ave
- 62 Blue Ridge Ln
- 537 Bloomfield Ave
- 165 Bloomfield Ave
- 47 Flagg Rd
- 111 Bloomfield Ave
- 12 Haviland Rd