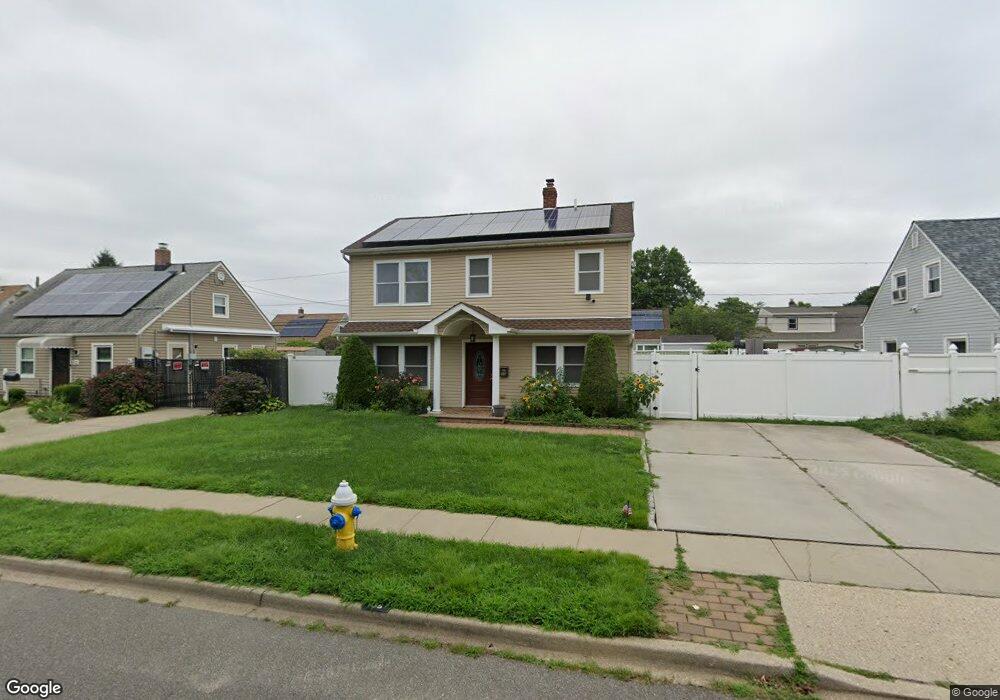
35 Pebble Ln Levittown, NY 11756
Estimated Value: $736,758 - $779,000
4
Beds
2
Baths
1,500
Sq Ft
$505/Sq Ft
Est. Value
About This Home
This home is located at 35 Pebble Ln, Levittown, NY 11756 and is currently estimated at $757,879, approximately $505 per square foot. 35 Pebble Ln is a home located in Nassau County with nearby schools including Abbey Lane Elementary School, Wisdom Lane Middle School, and Division Avenue Senior High School.
Ownership History
Date
Name
Owned For
Owner Type
Purchase Details
Closed on
Sep 24, 2014
Sold by
Euro Properties Llc
Bought by
Ramos Carlos S
Current Estimated Value
Home Financials for this Owner
Home Financials are based on the most recent Mortgage that was taken out on this home.
Original Mortgage
$407,483
Outstanding Balance
$318,829
Interest Rate
4.75%
Mortgage Type
FHA
Estimated Equity
$439,050
Purchase Details
Closed on
May 7, 2013
Sold by
Wood Philip
Bought by
Euro Properties Llc
Purchase Details
Closed on
Aug 2, 2000
Create a Home Valuation Report for This Property
The Home Valuation Report is an in-depth analysis detailing your home's value as well as a comparison with similar homes in the area
Home Values in the Area
Average Home Value in this Area
Purchase History
| Date | Buyer | Sale Price | Title Company |
|---|---|---|---|
| Ramos Carlos S | $415,000 | None Available | |
| Euro Properties Llc | $200,000 | -- | |
| -- | -- | -- |
Source: Public Records
Mortgage History
| Date | Status | Borrower | Loan Amount |
|---|---|---|---|
| Open | Ramos Carlos S | $407,483 |
Source: Public Records
Tax History
| Year | Tax Paid | Tax Assessment Tax Assessment Total Assessment is a certain percentage of the fair market value that is determined by local assessors to be the total taxable value of land and additions on the property. | Land | Improvement |
|---|---|---|---|---|
| 2025 | $15,993 | $484 | $217 | $267 |
| 2024 | $4,115 | $484 | $217 | $267 |
Source: Public Records
Map
Nearby Homes
Your Personal Tour Guide
Ask me questions while you tour the home.