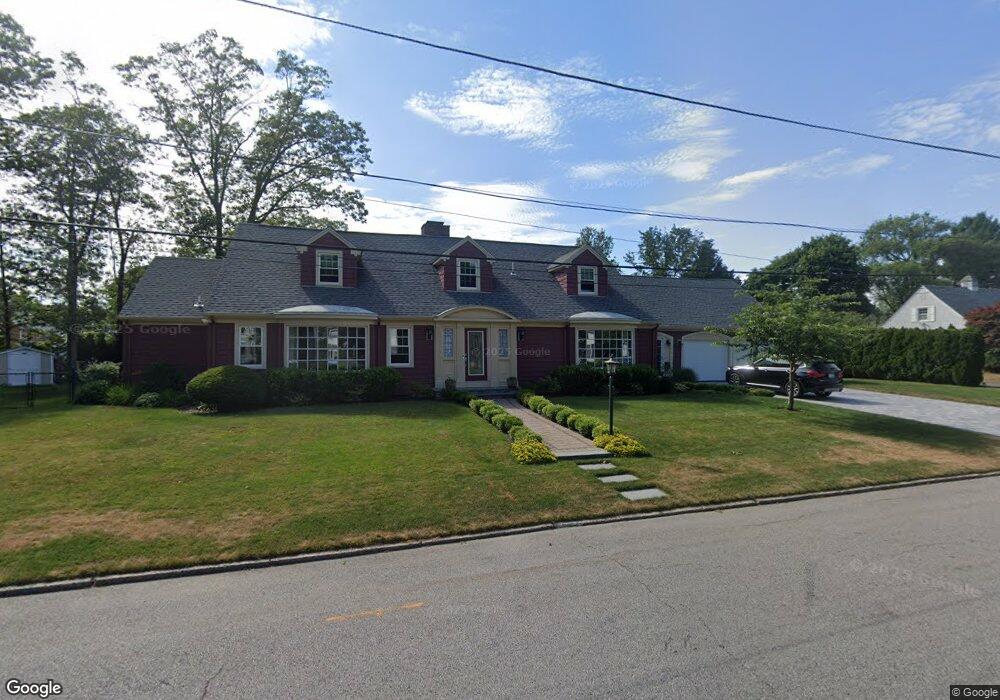
35 Pequot Rd Pawtucket, RI 02861
Darlington NeighborhoodEstimated Value: $705,000 - $1,055,000
5
Beds
4
Baths
5,232
Sq Ft
$166/Sq Ft
Est. Value
About This Home
This home is located at 35 Pequot Rd, Pawtucket, RI 02861 and is currently estimated at $866,187, approximately $165 per square foot. 35 Pequot Rd is a home located in Providence County with nearby schools including St Cecilia School and Saint Teresa Catholic Elementary School.
Ownership History
Date
Name
Owned For
Owner Type
Purchase Details
Closed on
Sep 21, 2001
Sold by
Mccarthy Elaine A
Bought by
Lynch William J and Lynch Lynn M
Current Estimated Value
Purchase Details
Closed on
Apr 21, 1994
Sold by
Troy Leo J and Troy Jeanne
Bought by
Mccarthy Stephen K and Mccarthy Elaine
Create a Home Valuation Report for This Property
The Home Valuation Report is an in-depth analysis detailing your home's value as well as a comparison with similar homes in the area
Home Values in the Area
Average Home Value in this Area
Purchase History
| Date | Buyer | Sale Price | Title Company |
|---|---|---|---|
| Lynch William J | $325,000 | -- | |
| Mccarthy Stephen K | $290,000 | -- |
Source: Public Records
Mortgage History
| Date | Status | Borrower | Loan Amount |
|---|---|---|---|
| Open | Mccarthy Stephen K | $372,000 | |
| Closed | Mccarthy Stephen K | $250,000 | |
| Closed | Mccarthy Stephen K | $165,000 |
Source: Public Records
Tax History Compared to Growth
Tax History
| Year | Tax Paid | Tax Assessment Tax Assessment Total Assessment is a certain percentage of the fair market value that is determined by local assessors to be the total taxable value of land and additions on the property. | Land | Improvement |
|---|---|---|---|---|
| 2025 | $8,804 | $669,500 | $165,900 | $503,600 |
| 2024 | $8,262 | $669,500 | $165,900 | $503,600 |
| 2023 | $9,373 | $553,300 | $126,800 | $426,500 |
| 2022 | $9,174 | $553,300 | $126,800 | $426,500 |
| 2021 | $9,174 | $553,300 | $126,800 | $426,500 |
| 2020 | $8,502 | $407,000 | $118,900 | $288,100 |
| 2019 | $8,502 | $407,000 | $118,900 | $288,100 |
| 2018 | $8,193 | $407,000 | $118,900 | $288,100 |
| 2017 | $8,940 | $393,500 | $123,400 | $270,100 |
| 2016 | $8,614 | $393,500 | $123,400 | $270,100 |
| 2015 | $8,614 | $393,500 | $123,400 | $270,100 |
| 2014 | $8,405 | $364,500 | $108,000 | $256,500 |
Source: Public Records
Map
Nearby Homes