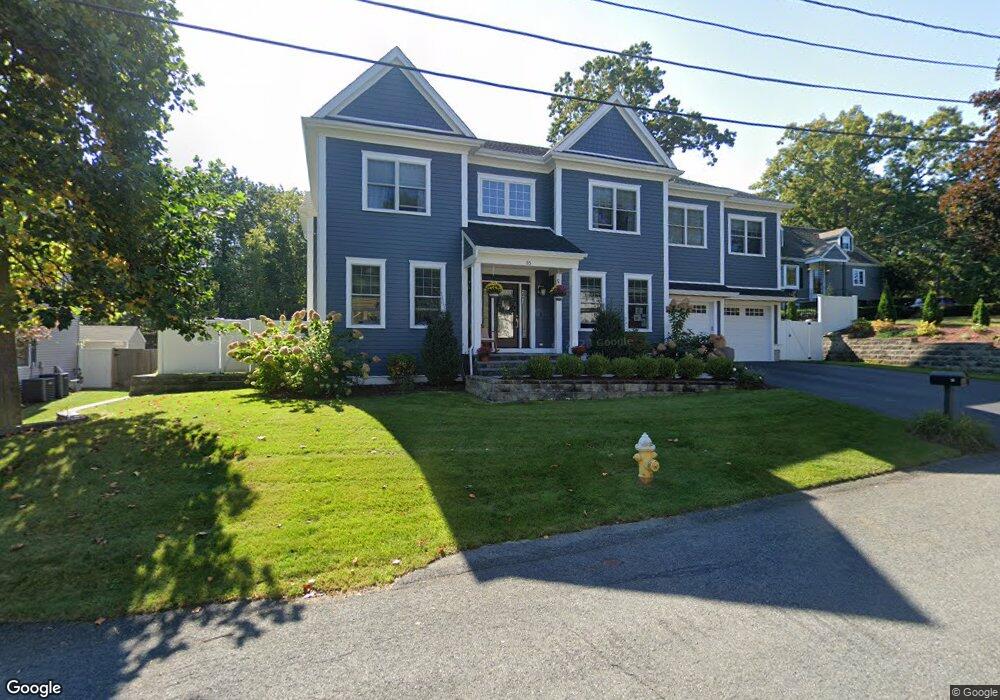
35 Pershing Rd Needham Heights, MA 02494
Estimated Value: $2,113,000 - $2,708,000
2
Beds
6
Baths
2,022
Sq Ft
$1,253/Sq Ft
Est. Value
About This Home
This home is located at 35 Pershing Rd, Needham Heights, MA 02494 and is currently estimated at $2,533,056, approximately $1,252 per square foot. 35 Pershing Rd is a home located in Norfolk County with nearby schools including Sunita L. Williams Elementary School, High Rock Middle School, and Pollard Middle School.
Ownership History
Date
Name
Owned For
Owner Type
Purchase Details
Closed on
Nov 5, 2019
Sold by
Westview Partners Llc
Bought by
Edwin Keith and Edwin Elysa
Current Estimated Value
Home Financials for this Owner
Home Financials are based on the most recent Mortgage that was taken out on this home.
Original Mortgage
$1,521,000
Outstanding Balance
$1,326,432
Interest Rate
3.6%
Mortgage Type
Purchase Money Mortgage
Estimated Equity
$1,206,624
Purchase Details
Closed on
Feb 1, 2019
Sold by
Kramer Terry N and Shimazu Yuiko
Bought by
Westview Partners Llc
Purchase Details
Closed on
Jun 25, 1993
Sold by
Seiden Jeffrey S and Seiden Nancyellen
Bought by
Kramer Terry N
Create a Home Valuation Report for This Property
The Home Valuation Report is an in-depth analysis detailing your home's value as well as a comparison with similar homes in the area
Home Values in the Area
Average Home Value in this Area
Purchase History
| Date | Buyer | Sale Price | Title Company |
|---|---|---|---|
| Edwin Keith | $1,901,250 | -- | |
| Edwin Keith | $1,901,250 | -- | |
| Edwin Keith | $1,901,250 | -- | |
| Westview Partners Llc | $715,000 | -- | |
| Westview Partners Llc | $715,000 | -- | |
| Westview Partners Llc | $715,000 | -- | |
| Kramer Terry N | $218,000 | -- | |
| Kramer Terry N | $218,000 | -- |
Source: Public Records
Mortgage History
| Date | Status | Borrower | Loan Amount |
|---|---|---|---|
| Open | Edwin Keith | $1,521,000 | |
| Closed | Edwin Keith | $1,521,000 | |
| Previous Owner | Kramer Terry N | $160,000 | |
| Previous Owner | Kramer Terry N | $50,000 |
Source: Public Records
Tax History Compared to Growth
Tax History
| Year | Tax Paid | Tax Assessment Tax Assessment Total Assessment is a certain percentage of the fair market value that is determined by local assessors to be the total taxable value of land and additions on the property. | Land | Improvement |
|---|---|---|---|---|
| 2025 | $24,790 | $2,338,700 | $765,900 | $1,572,800 |
| 2024 | $27,998 | $2,236,300 | $508,300 | $1,728,000 |
| 2023 | $27,387 | $2,100,200 | $508,300 | $1,591,900 |
| 2022 | $26,058 | $1,949,000 | $459,600 | $1,489,400 |
| 2021 | $25,395 | $1,949,000 | $459,600 | $1,489,400 |
| 2020 | $14,382 | $1,151,500 | $459,600 | $691,900 |
| 2019 | $7,042 | $568,400 | $419,400 | $149,000 |
| 2018 | $6,753 | $568,400 | $419,400 | $149,000 |
| 2017 | $6,534 | $549,500 | $419,400 | $130,100 |
| 2016 | $6,341 | $549,500 | $419,400 | $130,100 |
| 2015 | $6,204 | $549,500 | $419,400 | $130,100 |
| 2014 | $5,921 | $508,700 | $382,800 | $125,900 |
Source: Public Records
Map
Nearby Homes
- 34 Pershing Rd
- 11 Shirley Rd
- 100 Rosemary Way Unit 129
- 100 Rosemary Way Unit 324
- 445 Hillside Ave
- 3 Crescent Rd
- 3 Hancock Rd
- a136 Hillside
- a136 Hillside Unit a
- 379 Hunnewell St Unit 379
- 400 Hunnewell St Unit 103
- 132 Hillside Ave
- 52 Hancock Rd
- 266 Hunnewell St
- 40 High St
- 556 Webster St
- 193 Garden St
- 638 Webster St Unit 638
- 443 Central Ave
- 98 Hunnewell St