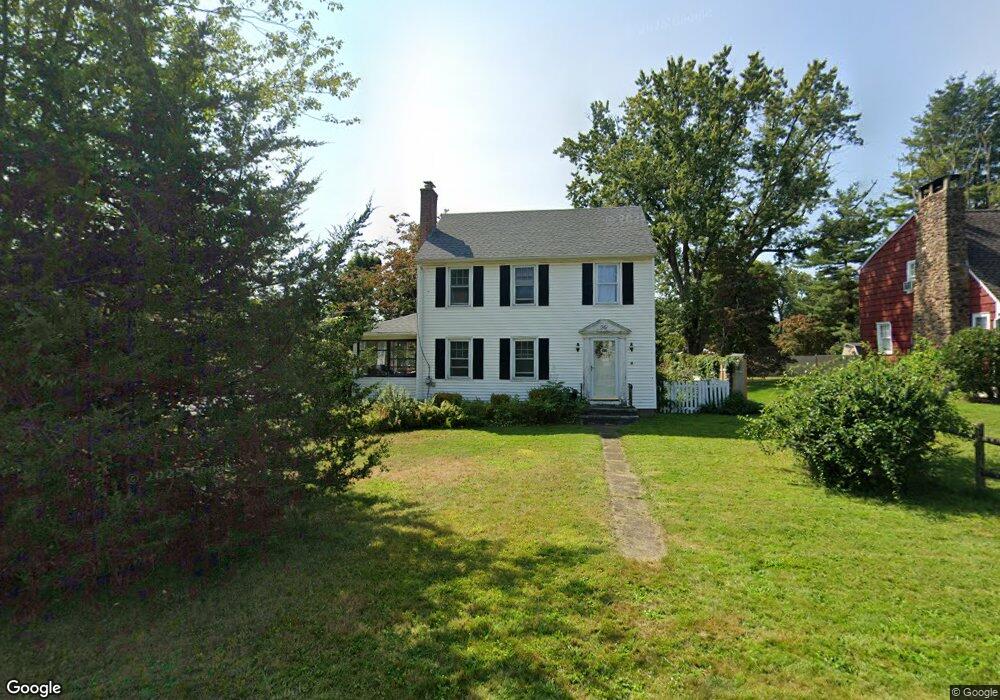
35 Phedon Pkwy Middletown, CT 06457
Westfield NeighborhoodEstimated Value: $326,000 - $331,599
3
Beds
1
Bath
1,332
Sq Ft
$247/Sq Ft
Est. Value
About This Home
This home is located at 35 Phedon Pkwy, Middletown, CT 06457 and is currently estimated at $328,400, approximately $246 per square foot. 35 Phedon Pkwy is a home located in Middlesex County with nearby schools including St John Paul II School.
Ownership History
Date
Name
Owned For
Owner Type
Purchase Details
Closed on
Apr 12, 2016
Sold by
Ellis Tara
Bought by
Ellis Tara and Ellis Jon E
Current Estimated Value
Purchase Details
Closed on
Apr 29, 2011
Sold by
Sabin Matthew S and Sabin Ann L
Bought by
Ellis Tara
Home Financials for this Owner
Home Financials are based on the most recent Mortgage that was taken out on this home.
Original Mortgage
$146,100
Interest Rate
4.76%
Purchase Details
Closed on
Jan 19, 2000
Sold by
Mock Jeremy W and Mock Tracy A
Bought by
Sabin Matthew S and Sabin Louise
Purchase Details
Closed on
Dec 31, 1996
Sold by
Verea Armando and Verea Susan B
Bought by
Mock Jeremy W and Mock Tracy A
Purchase Details
Closed on
Nov 22, 1993
Sold by
Wesleyan University
Bought by
Verea Armando and Verea Susan B
Create a Home Valuation Report for This Property
The Home Valuation Report is an in-depth analysis detailing your home's value as well as a comparison with similar homes in the area
Home Values in the Area
Average Home Value in this Area
Purchase History
| Date | Buyer | Sale Price | Title Company |
|---|---|---|---|
| Ellis Tara | -- | -- | |
| Ellis Tara | $150,000 | -- | |
| Sabin Matthew S | $139,900 | -- | |
| Mock Jeremy W | $122,000 | -- | |
| Verea Armando | $117,500 | -- |
Source: Public Records
Mortgage History
| Date | Status | Borrower | Loan Amount |
|---|---|---|---|
| Previous Owner | Ellis Tara | $146,100 | |
| Previous Owner | Verea Armando | $184,500 | |
| Previous Owner | Verea Armando | $152,000 | |
| Previous Owner | Verea Armando | $138,592 |
Source: Public Records
Tax History Compared to Growth
Tax History
| Year | Tax Paid | Tax Assessment Tax Assessment Total Assessment is a certain percentage of the fair market value that is determined by local assessors to be the total taxable value of land and additions on the property. | Land | Improvement |
|---|---|---|---|---|
| 2025 | $6,073 | $156,110 | $56,510 | $99,600 |
| 2024 | $5,745 | $156,110 | $56,510 | $99,600 |
| 2023 | $5,479 | $156,110 | $56,510 | $99,600 |
| 2022 | $5,005 | $113,760 | $37,670 | $76,090 |
| 2021 | $5,005 | $113,760 | $37,670 | $76,090 |
| 2020 | $6,717 | $113,760 | $37,670 | $76,090 |
| 2019 | $6,757 | $113,760 | $37,670 | $76,090 |
| 2018 | $4,971 | $113,760 | $37,670 | $76,090 |
| 2017 | $6,722 | $110,240 | $40,370 | $69,870 |
| 2016 | $4,542 | $110,240 | $40,370 | $69,870 |
| 2015 | $4,366 | $110,240 | $40,370 | $69,870 |
| 2014 | $4,410 | $110,240 | $40,370 | $69,870 |
Source: Public Records
Map
Nearby Homes
- 18 Phedon Pkwy
- 3 Nathan Hale Rd
- 4 Nathan Hale Rd
- 1 Nathan Hale Rd
- 2 Nathan Hale Rd
- 31 Broadview Pkwy
- 60 Old Mill Rd
- 27 Barbara Rd
- 136 Westfield St
- 82 Westfield Terrace
- 180 Bailey Rd
- 59 Westfield Terrace
- 27 Valley Dr
- 59 Willow Bee Ln
- 84 Camp St
- 160 Boston Rd
- 36 Brookview Ln
- 91 Highview Terrace
- 122 Nejako Dr
- 237 Boston Rd
- 185 Barbara Rd
- 19 Phedon Pkwy
- 190 Barbara Rd
- 217 Barbara Rd
- 51 Phedon Pkwy
- 57 Phedon Pkwy
- 177 Barbara Rd
- 22 Phedon Pkwy
- 180 Barbara Rd
- 44 Phedon Pkwy
- 221 Barbara Rd
- 169 Barbara Rd
- 56 Phedon Pkwy
- 0 Barbara Rd
- 30 Nathan Hale Rd
- 0 Phedon Pkwy
- 147 Old Mill Rd
- 32 Nathan Hale Rd
- 58 Phedon Pkwy
- 220 Barbara Rd