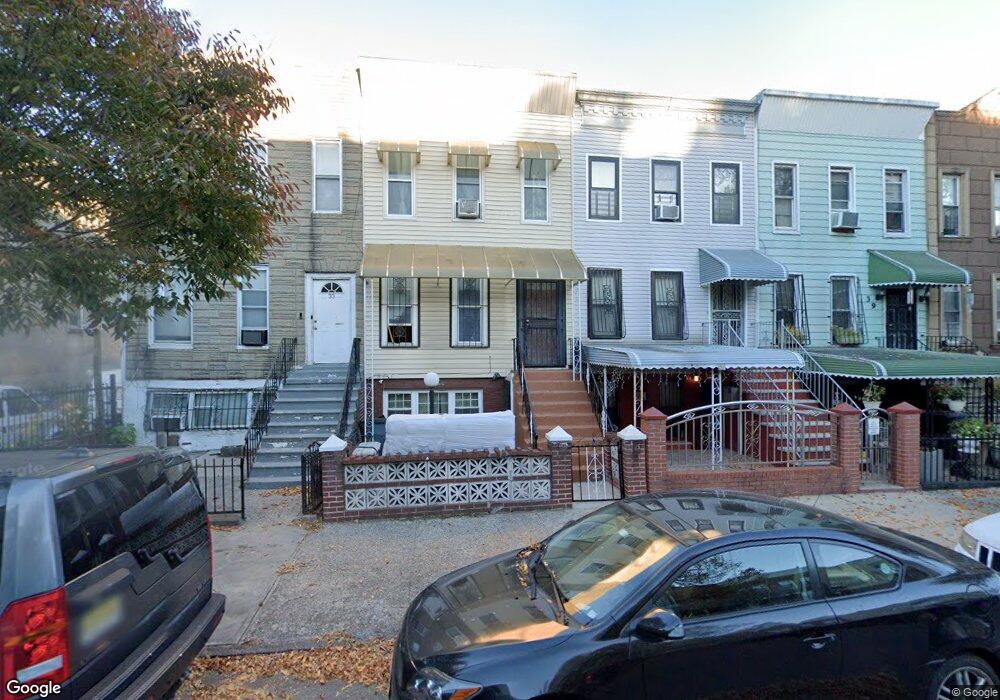
35 Pilling St Unit 2 Brooklyn, NY 11207
Bushwick NeighborhoodEstimated Value: $955,259 - $1,202,000
1
Bed
1
Bath
2,001
Sq Ft
$533/Sq Ft
Est. Value
About This Home
This home is located at 35 Pilling St Unit 2, Brooklyn, NY 11207 and is currently estimated at $1,066,565, approximately $533 per square foot. 35 Pilling St Unit 2 is a home located in Kings County with nearby schools including P.S./I.S. 137 Rachel Jean Mitchell, P.S. Is 155 Nicholas Herkimer, and P.S. 178 Saint Clair Mckelway.
Ownership History
Date
Name
Owned For
Owner Type
Purchase Details
Closed on
Aug 15, 2007
Sold by
Holder Martha
Bought by
Holder Bryan D and Holder Martha
Current Estimated Value
Purchase Details
Closed on
Jun 14, 2007
Sold by
Holder Martha and Mighty Errol
Bought by
Holder Martha
Purchase Details
Closed on
Oct 25, 2006
Sold by
Mighty Errol
Bought by
Holder Martha and Mighty Errol
Purchase Details
Closed on
Aug 19, 2005
Sold by
Holder Martha
Bought by
Mighty Errol
Home Financials for this Owner
Home Financials are based on the most recent Mortgage that was taken out on this home.
Original Mortgage
$315,000
Interest Rate
5.81%
Mortgage Type
Purchase Money Mortgage
Purchase Details
Closed on
Sep 2, 1997
Sold by
Cooper Fred
Bought by
Holder Martha
Home Financials for this Owner
Home Financials are based on the most recent Mortgage that was taken out on this home.
Original Mortgage
$168,610
Interest Rate
7.48%
Mortgage Type
FHA
Create a Home Valuation Report for This Property
The Home Valuation Report is an in-depth analysis detailing your home's value as well as a comparison with similar homes in the area
Home Values in the Area
Average Home Value in this Area
Purchase History
| Date | Buyer | Sale Price | Title Company |
|---|---|---|---|
| Holder Bryan D | -- | -- | |
| Holder Bryan D | -- | -- | |
| Holder Martha | -- | -- | |
| Holder Martha | -- | -- | |
| Holder Martha | -- | -- | |
| Holder Martha | -- | -- | |
| Mighty Errol | $350,000 | -- | |
| Mighty Errol | $350,000 | -- | |
| Holder Martha | $170,000 | Fidelity National Title Ins | |
| Holder Martha | $170,000 | Fidelity National Title Ins |
Source: Public Records
Mortgage History
| Date | Status | Borrower | Loan Amount |
|---|---|---|---|
| Previous Owner | Mighty Errol | $315,000 | |
| Previous Owner | Holder Martha | $168,610 | |
| Closed | Holder Martha | $0 |
Source: Public Records
Tax History Compared to Growth
Tax History
| Year | Tax Paid | Tax Assessment Tax Assessment Total Assessment is a certain percentage of the fair market value that is determined by local assessors to be the total taxable value of land and additions on the property. | Land | Improvement |
|---|---|---|---|---|
| 2025 | $2,551 | $69,840 | $9,240 | $60,600 |
| 2024 | $2,551 | $55,800 | $9,240 | $46,560 |
| 2023 | $2,418 | $49,320 | $9,240 | $40,080 |
| 2022 | $2,224 | $53,040 | $9,240 | $43,800 |
| 2021 | $2,203 | $53,940 | $9,240 | $44,700 |
| 2020 | $1,094 | $60,000 | $9,240 | $50,760 |
| 2019 | $2,165 | $60,000 | $9,240 | $50,760 |
| 2018 | $1,963 | $13,046 | $2,220 | $10,826 |
| 2017 | $2,056 | $12,330 | $2,310 | $10,020 |
| 2016 | $1,870 | $11,643 | $2,944 | $8,699 |
| 2015 | $1,107 | $11,643 | $3,304 | $8,339 |
| 2014 | $1,107 | $11,520 | $3,922 | $7,598 |
Source: Public Records
Map
Nearby Homes
- 12 Pilling St
- 45 Pilling St
- 1474 Bushwick Ave Unit 2R
- 1474 Bushwick Ave Unit 4R
- 88 Granite St
- 1408 Bushwick Ave
- 65 Granite St
- 696 Chauncey St Unit 3A
- 696 Chauncey St Unit 2B
- 696 Chauncey St Unit 3B
- 696 Chauncey St Unit 2A
- 696 Chauncey St Unit TWNHSE
- 1404 Bushwick Ave Unit 1
- 1411 Bushwick Ave Unit 3A
- 1411 Bushwick Ave Unit 4A
- 1411 Bushwick Ave Unit 5 B
- 1411 Bushwick Ave Unit 3 B
- 1411 Bushwick Ave Unit 3 C
- 1411 Bushwick Ave Unit 2 C
- 1411 Bushwick Ave Unit 2 B
- 35 Pilling St
- 37 Pilling St
- 33 Pilling St
- 39 Pilling St
- 29 Pilling St
- 41 Pilling St
- 41 Pilling St Unit 3
- 41 Pilling St Unit 2
- 27 Pilling St
- 43 Pilling St
- 43 Pilling St Unit 1
- 25 Pilling St
- 25 Pilling St
- 25 Pilling St Unit 1
- 45 Pilling St Unit Building
- 23 Pilling St
- 23 Pilling St
- 23 Pilling St
- 23 Pilling St Unit G
- 23 Pilling St Unit 1