Estimated Value: $1,243,203 - $1,575,000
3
Beds
3
Baths
2,889
Sq Ft
$483/Sq Ft
Est. Value
About This Home
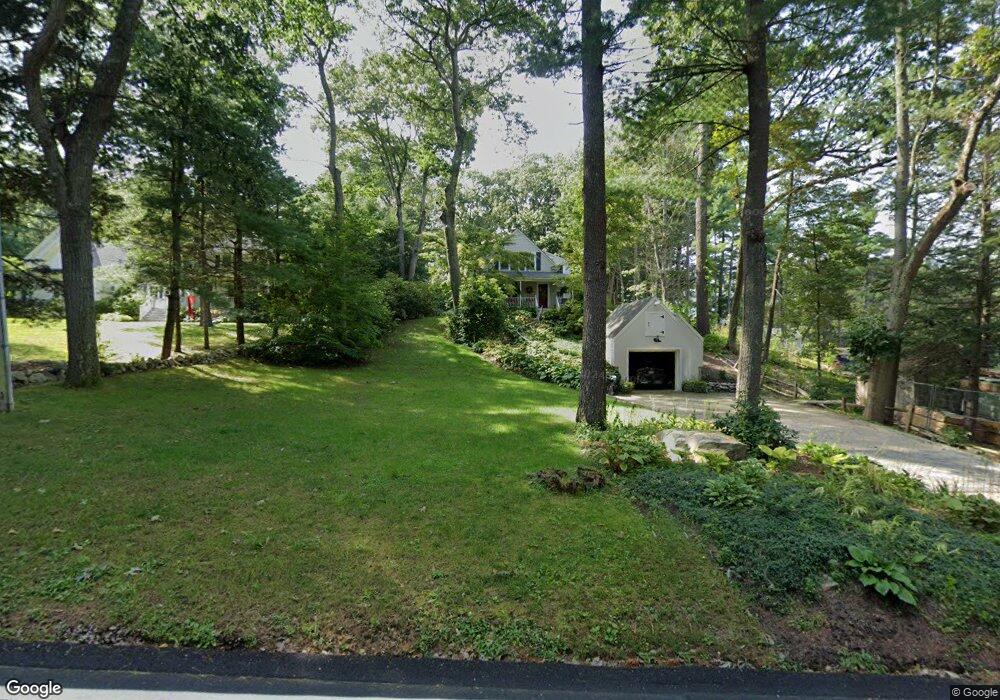
This home is located at 35 Pine St, Dover, MA 02030 and is currently estimated at $1,395,801, approximately $483 per square foot. 35 Pine St is a home located in Norfolk County with nearby schools including Chickering Elementary School, Dover-Sherborn Regional Middle School, and Dover-Sherborn Regional High School.
Ownership History
Date
Name
Owned For
Owner Type
Purchase Details
Closed on
Jan 8, 2014
Sold by
Riess Mariah E
Bought by
35 Pine Street Nt
Current Estimated Value
Purchase Details
Closed on
May 28, 1991
Sold by
Hollyer Thomas and Hollyer Lisa B
Bought by
Smith Roger W and Smith Mariah
Create a Home Valuation Report for This Property
The Home Valuation Report is an in-depth analysis detailing your home's value as well as a comparison with similar homes in the area
Home Values in the Area
Average Home Value in this Area
Purchase History
| Date | Buyer | Sale Price | Title Company |
|---|---|---|---|
| 35 Pine Street Nt | -- | -- | |
| Smith Roger W | $260,000 | -- |
Source: Public Records
Mortgage History
| Date | Status | Borrower | Loan Amount |
|---|---|---|---|
| Previous Owner | Smith Roger W | $120,000 | |
| Previous Owner | Smith Roger W | $160,000 | |
| Previous Owner | Smith Roger W | $35,000 |
Source: Public Records
Tax History
| Year | Tax Paid | Tax Assessment Tax Assessment Total Assessment is a certain percentage of the fair market value that is determined by local assessors to be the total taxable value of land and additions on the property. | Land | Improvement |
|---|---|---|---|---|
| 2025 | $11,905 | $1,056,300 | $578,700 | $477,600 |
| 2024 | $10,822 | $987,400 | $539,500 | $447,900 |
| 2023 | $10,447 | $857,000 | $470,700 | $386,300 |
| 2022 | $9,597 | $772,700 | $431,500 | $341,200 |
| 2021 | $9,790 | $759,500 | $372,700 | $386,800 |
| 2020 | $9,752 | $759,500 | $372,700 | $386,800 |
| 2019 | $9,685 | $749,000 | $372,700 | $376,300 |
| 2018 | $9,114 | $709,800 | $372,700 | $337,100 |
| 2017 | $8,493 | $650,800 | $323,700 | $327,100 |
| 2016 | $7,938 | $616,300 | $313,900 | $302,400 |
| 2015 | $8,200 | $645,700 | $343,300 | $302,400 |
Source: Public Records
Map
Nearby Homes
Your Personal Tour Guide
Ask me questions while you tour the home.