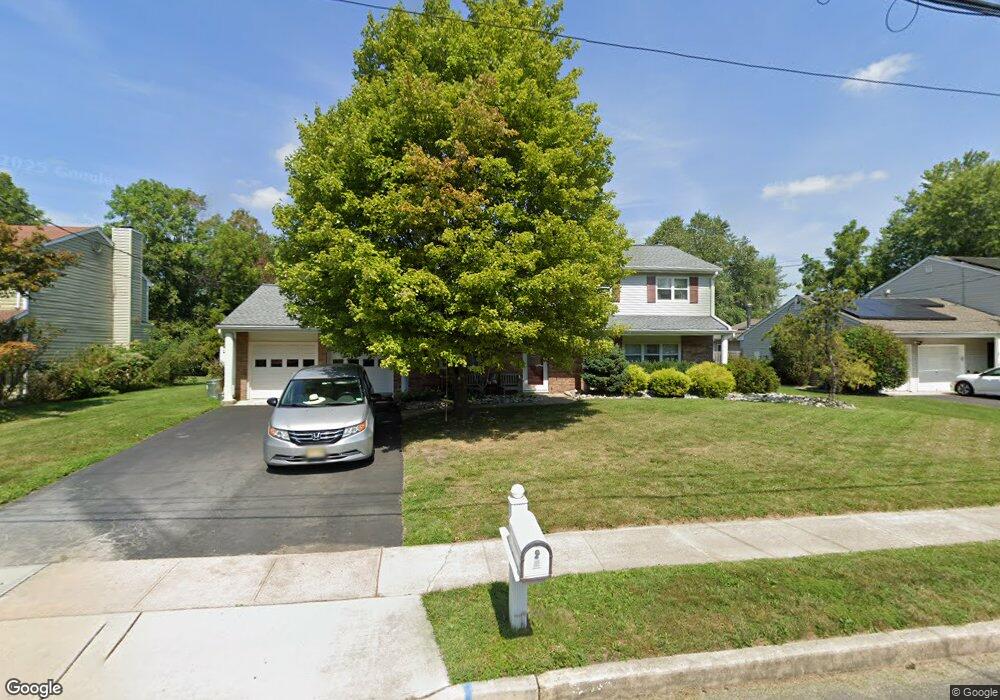
35 Probasco Dr Allentown, NJ 08501
Estimated Value: $652,000 - $689,611
4
Beds
3
Baths
2,047
Sq Ft
$328/Sq Ft
Est. Value
About This Home
This home is located at 35 Probasco Dr, Allentown, NJ 08501 and is currently estimated at $671,903, approximately $328 per square foot. 35 Probasco Dr is a home located in Monmouth County with nearby schools including Newell Elementary School, Stonebridge Middle School, and Allentown High School.
Ownership History
Date
Name
Owned For
Owner Type
Purchase Details
Closed on
Jul 25, 2019
Sold by
Beggs Matthew and Beggs Elizabeth
Bought by
Mojta Patricia and Mojta Brian
Current Estimated Value
Home Financials for this Owner
Home Financials are based on the most recent Mortgage that was taken out on this home.
Original Mortgage
$300,000
Outstanding Balance
$262,174
Interest Rate
3.7%
Mortgage Type
New Conventional
Estimated Equity
$409,729
Purchase Details
Closed on
Mar 18, 2016
Sold by
Soares Alfredo
Bought by
Beggs Matthew and Beggs Elizabeth
Purchase Details
Closed on
Sep 8, 2006
Sold by
Manukas George D
Bought by
Soares Alfredo
Home Financials for this Owner
Home Financials are based on the most recent Mortgage that was taken out on this home.
Original Mortgage
$320,000
Interest Rate
6.59%
Mortgage Type
New Conventional
Create a Home Valuation Report for This Property
The Home Valuation Report is an in-depth analysis detailing your home's value as well as a comparison with similar homes in the area
Home Values in the Area
Average Home Value in this Area
Purchase History
| Date | Buyer | Sale Price | Title Company |
|---|---|---|---|
| Mojta Patricia | $375,000 | Fidelity National Title | |
| Beggs Matthew | $345,000 | Title Evolution Llc | |
| Soares Alfredo | $420,000 | -- |
Source: Public Records
Mortgage History
| Date | Status | Borrower | Loan Amount |
|---|---|---|---|
| Open | Mojta Patricia | $300,000 | |
| Previous Owner | Soares Alfredo | $320,000 |
Source: Public Records
Tax History
| Year | Tax Paid | Tax Assessment Tax Assessment Total Assessment is a certain percentage of the fair market value that is determined by local assessors to be the total taxable value of land and additions on the property. | Land | Improvement |
|---|---|---|---|---|
| 2025 | $10,928 | $339,600 | $151,300 | $188,300 |
| 2024 | $9,774 | $339,600 | $151,300 | $188,300 |
| 2023 | $9,774 | $339,600 | $151,300 | $188,300 |
| 2022 | $10,276 | $339,600 | $151,300 | $188,300 |
| 2021 | $10,276 | $339,600 | $151,300 | $188,300 |
| 2020 | $10,022 | $339,600 | $151,300 | $188,300 |
| 2019 | $10,286 | $339,600 | $151,300 | $188,300 |
| 2018 | $10,344 | $339,600 | $151,300 | $188,300 |
| 2017 | $10,351 | $339,600 | $151,300 | $188,300 |
| 2016 | $10,331 | $339,600 | $151,300 | $188,300 |
| 2015 | $9,557 | $337,600 | $151,300 | $186,300 |
| 2014 | $9,476 | $337,600 | $151,300 | $186,300 |
Source: Public Records
Map
Nearby Homes
- 16 Greenfield Dr
- 34 N Main St
- 37 Waldron Rd
- 22 Route 524
- 501 Circle Dr
- 81 Potts Rd
- 467 Gordon Rd
- 30 Ridgeview Way
- 33 Bunker Hill Dr
- 40 Bunker Hill Dr
- 0 Robbinsville Allentown Rd
- 10 Powderhorn Way
- 16 Powderhorn Way
- 12 Westbury Ct
- 222 Ivanhoe Dr
- 327 Sharon Rd
- 0 Merrick Rd
- 1400 Old York Rd
- 3 Dartmouth Ct
- 6 Meetinghouse Rd
Your Personal Tour Guide
Ask me questions while you tour the home.