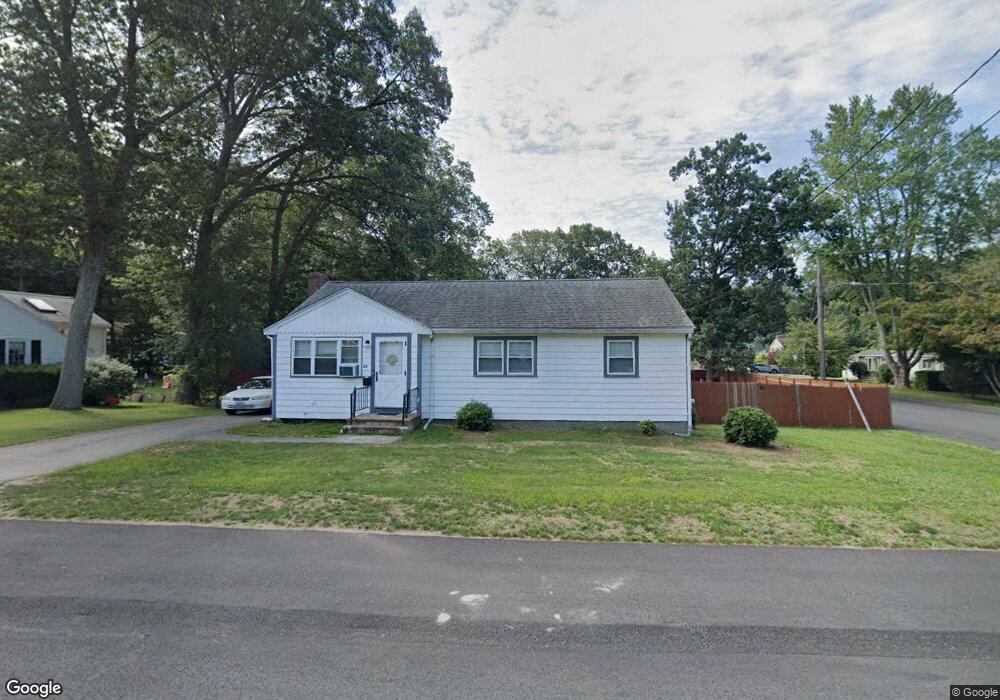
35 Progress St Weymouth, MA 02188
South Weymouth NeighborhoodEstimated Value: $549,000 - $568,000
3
Beds
2
Baths
1,018
Sq Ft
$550/Sq Ft
Est. Value
About This Home
This home is located at 35 Progress St, Weymouth, MA 02188 and is currently estimated at $559,858, approximately $549 per square foot. 35 Progress St is a home located in Norfolk County with nearby schools including Frederick C Murphy, Abigail Adams Middle School, and Weymouth Middle School Chapman.
Ownership History
Date
Name
Owned For
Owner Type
Purchase Details
Closed on
Aug 31, 2007
Sold by
Eckblad Jean S
Bought by
Giurleo Erin P and Giurleo Joseph N
Current Estimated Value
Home Financials for this Owner
Home Financials are based on the most recent Mortgage that was taken out on this home.
Original Mortgage
$150,000
Outstanding Balance
$95,649
Interest Rate
6.71%
Mortgage Type
Purchase Money Mortgage
Estimated Equity
$464,209
Create a Home Valuation Report for This Property
The Home Valuation Report is an in-depth analysis detailing your home's value as well as a comparison with similar homes in the area
Home Values in the Area
Average Home Value in this Area
Purchase History
| Date | Buyer | Sale Price | Title Company |
|---|---|---|---|
| Giurleo Erin P | $305,000 | -- |
Source: Public Records
Mortgage History
| Date | Status | Borrower | Loan Amount |
|---|---|---|---|
| Open | Giurleo Erin P | $150,000 |
Source: Public Records
Tax History
| Year | Tax Paid | Tax Assessment Tax Assessment Total Assessment is a certain percentage of the fair market value that is determined by local assessors to be the total taxable value of land and additions on the property. | Land | Improvement |
|---|---|---|---|---|
| 2025 | $5,131 | $508,000 | $256,500 | $251,500 |
| 2024 | $5,106 | $497,200 | $244,300 | $252,900 |
| 2023 | $4,811 | $460,400 | $226,200 | $234,200 |
| 2022 | $4,560 | $397,900 | $192,000 | $205,900 |
| 2021 | $4,251 | $362,100 | $192,000 | $170,100 |
| 2020 | $4,017 | $337,000 | $192,000 | $145,000 |
| 2019 | $3,855 | $318,100 | $184,600 | $133,500 |
| 2018 | $3,795 | $303,600 | $175,800 | $127,800 |
| 2017 | $3,705 | $289,200 | $167,500 | $121,700 |
| 2016 | $3,560 | $278,100 | $161,000 | $117,100 |
| 2015 | $3,358 | $260,300 | $153,700 | $106,600 |
| 2014 | $3,290 | $247,400 | $143,100 | $104,300 |
Source: Public Records
Map
Nearby Homes
- 501 Commerce Dr Unit 2310
- 501 Commerce Dr Unit 4308
- 82 Lester Ln
- 73 Ryder Rd
- 300 West St
- 17 Berean Way
- 107 Summer St
- 432 Grove St
- 8 Tara Dr Unit 4
- 8 Tara Dr Unit 5
- 33 Congress St
- 972 Liberty St
- 15 Summer St
- 31 Doris Rd
- 747 Middle St
- 2 Mitchell Ln Unit B
- 54 Old Quarry Dr
- 116 Greenvale Ave
- 19 Vine St Unit 3
- 19 Vine St Unit 2
- 43 Progress St
- 16 Fairway St
- 21 Progress St
- 36 Progress St
- 28 Progress St
- 15 Fairway St
- 51 Progress St
- 51 Progress St Unit xxxxx
- 51 Progress St Unit 1
- 51 Progress St Unit Single Fam
- 44 Progress St
- 22 Fairway St
- 15 Jacquelyn Rd
- 20 Progress St
- 21 Fairway St
- 21 Fairway St Unit 21,4
- 15 Progress St
- 52 Progress St
- 27 Jacquelyn Rd
- 12 Progress St
Your Personal Tour Guide
Ask me questions while you tour the home.