
Landlord's Agent in 2016
Daniel Tully
Symphony Properties
(617) 448-9783
12 in this area
87 Total Sales
Estimated Value: $541,000 - $586,000
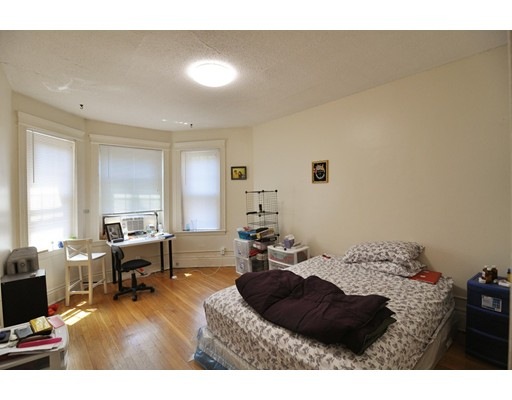
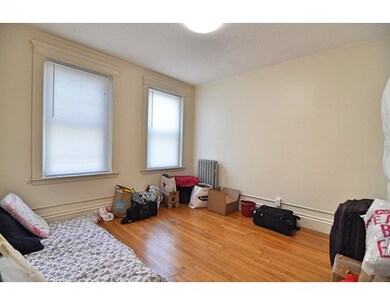
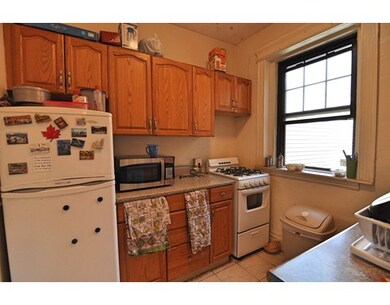
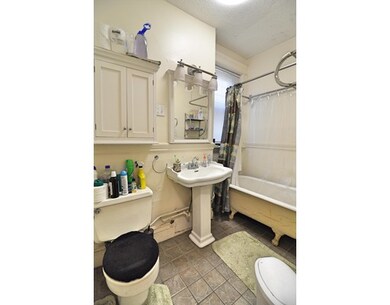
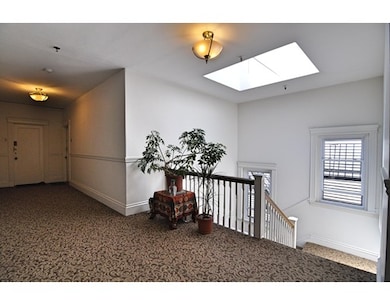
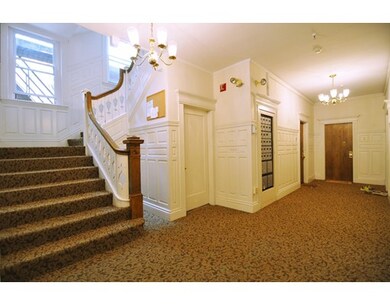
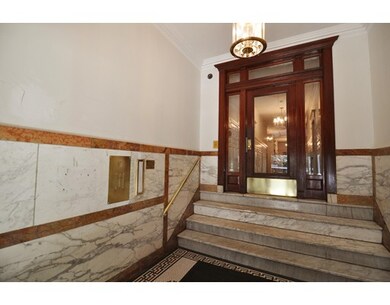
This front facing, top floor one bedroom (2BR split) one bath is located in Boston's Fenway neighborhood. This desirable area is located within close proximity to Back Bay and Downtown Boston, has a neighborhood feel, several restaurants, shopping, and Fenway Park. Heat and hot water are included in the monthly rent, as well as professional management and common laundry in the elevator building.
Home Type
Other
Est. Annual Taxes
$5,328
Year Built
1899
Lot Details
0
| Date | Buyer | Sale Price | Title Company |
|---|---|---|---|
| Chami Hassan | $375,000 | -- | |
| Ruggieri Alexander | $252,500 | -- | |
| Ruggieri Alexander | $252,500 | -- |
| Date | Status | Borrower | Loan Amount |
|---|---|---|---|
| Open | Chami Hassan | $225,000 | |
| Closed | Ruggieri Alexander | $225,000 | |
| Previous Owner | Ruggieri Alexander | $252,500 |
| Date | Event | Price | List to Sale | Price per Sq Ft | Prior Sale |
|---|---|---|---|---|---|
| 09/01/2016 09/01/16 | Rented | $2,300 | 0.0% | -- | |
| 08/05/2016 08/05/16 | Under Contract | -- | -- | -- | |
| 07/21/2016 07/21/16 | For Rent | $2,300 | 0.0% | -- | |
| 12/11/2015 12/11/15 | Sold | $375,000 | -6.2% | $676 / Sq Ft | View Prior Sale |
| 10/16/2015 10/16/15 | Pending | -- | -- | -- | |
| 09/24/2015 09/24/15 | For Sale | $399,900 | 0.0% | $721 / Sq Ft | |
| 08/27/2012 08/27/12 | Rented | $1,600 | 0.0% | -- | |
| 07/28/2012 07/28/12 | Under Contract | -- | -- | -- | |
| 06/08/2012 06/08/12 | For Rent | $1,600 | -- | -- |
| Year | Tax Paid | Tax Assessment Tax Assessment Total Assessment is a certain percentage of the fair market value that is determined by local assessors to be the total taxable value of land and additions on the property. | Land | Improvement |
|---|---|---|---|---|
| 2025 | $5,328 | $460,100 | $0 | $460,100 |
| 2024 | $4,969 | $455,900 | $0 | $455,900 |
| 2023 | $4,750 | $442,300 | $0 | $442,300 |
| 2022 | $4,720 | $433,800 | $0 | $433,800 |
| 2021 | $4,538 | $425,300 | $0 | $425,300 |
| 2020 | $4,624 | $437,900 | $0 | $437,900 |
| 2019 | $4,315 | $409,400 | $0 | $409,400 |
| 2018 | $3,973 | $379,100 | $0 | $379,100 |
| 2017 | $3,822 | $360,900 | $0 | $360,900 |
| 2016 | $3,781 | $343,700 | $0 | $343,700 |
| 2015 | $4,036 | $333,300 | $0 | $333,300 |
| 2014 | $3,305 | $262,700 | $0 | $262,700 |
Landlord's Agent in 2016
Daniel Tully
Symphony Properties
(617) 448-9783
12 in this area
87 Total Sales
K
Seller's Agent in 2015
Kevin Cleary
RE/MAX
J
Seller's Agent in 2012
Jay Cleary
CLEARE
Source: MLS Property Information Network (MLS PIN)
MLS Number: 72041887
APN: CBOS-000000-000005-004245-000094
Disclaimer: Certain information contained herein is derived from information provided by parties other than Homes.com. All information provided is deemed reliable, but is not guaranteed to be accurate and should be independently verified.
![]() The property listing data and information, or the Images, set forth herein were provided to MLS Property Information Network, Inc. from third party sources, including sellers, lessors and public records, and were compiled by MLS Property Information Network, Inc. The property listing data and information, and the Images, are for the personal, non-commercial use of consumers having a good faith interest in purchasing or leasing listed properties of the type displayed to them and may not be used for any purpose other than to identify prospective properties which such consumers may have a good faith interest in purchasing or leasing. MLS Property Information Network, Inc. and its subscribers disclaim any and all representations and warranties as to the accuracy of the property listing data and information, or as to the accuracy of any of the Images, set forth herein.
The property listing data and information, or the Images, set forth herein were provided to MLS Property Information Network, Inc. from third party sources, including sellers, lessors and public records, and were compiled by MLS Property Information Network, Inc. The property listing data and information, and the Images, are for the personal, non-commercial use of consumers having a good faith interest in purchasing or leasing listed properties of the type displayed to them and may not be used for any purpose other than to identify prospective properties which such consumers may have a good faith interest in purchasing or leasing. MLS Property Information Network, Inc. and its subscribers disclaim any and all representations and warranties as to the accuracy of the property listing data and information, or as to the accuracy of any of the Images, set forth herein.