35 Quincy St Springfield, MA 01109
Old Hill NeighborhoodEstimated Value: $266,011 - $330,000
About This Home
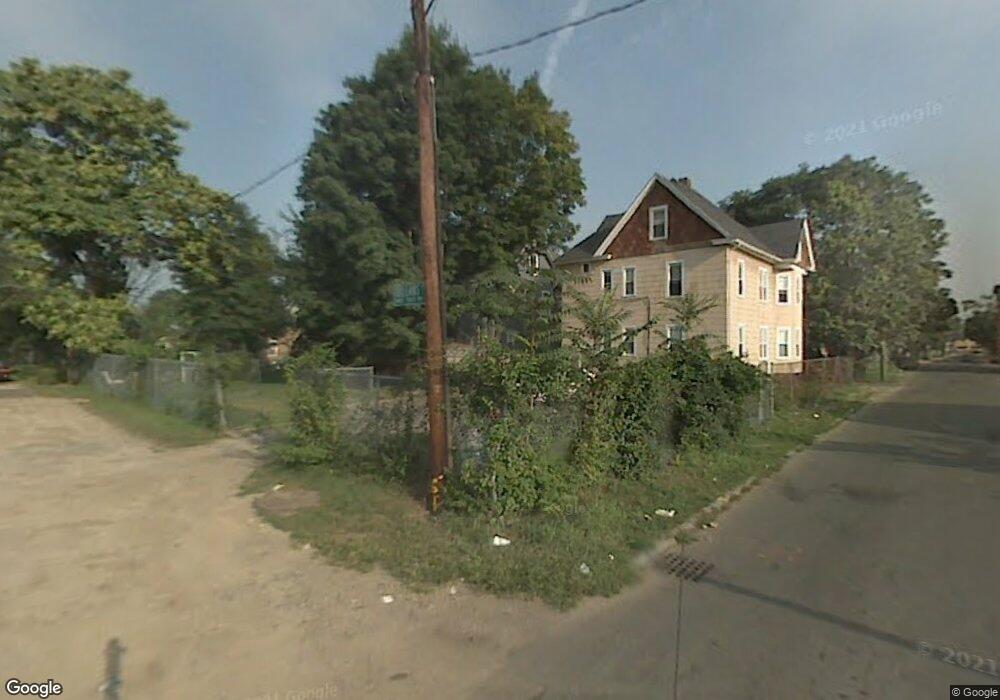
This home is located at 35 Quincy St, Springfield, MA 01109 and is currently estimated at $293,753, approximately $104 per square foot. 35 Quincy St is a home located in Hampden County with nearby schools including William N. DeBerry Elementary School, M Marcus Kiley Middle, and High School Of Commerce.
Ownership History
We collect this data history from publicly available records. To have your information removed, we recommend requesting removal directly through your county’s website.
Purchase Details
Purchase Details
Purchase Details
Purchase Details
Home Financials for this Owner
Home Financials are based on the most recent Mortgage that was taken out on this home.Home Values in the Area
Average Home Value in this Area
Purchase History
We collect this data history from publicly available records. To have your information removed, we recommend requesting removal directly through your county’s website.
| Date | Buyer | Sale Price | Title Company |
|---|---|---|---|
| $150,000 | None Available | ||
| $25,000 | -- | ||
| $25,000 | -- | ||
| $19,000 | -- | ||
| $163,186 | -- | ||
| $163,186 | -- | ||
| $163,186 | -- | ||
| $175,000 | -- | ||
| $175,000 | -- |
Mortgage History
We collect this data history from publicly available records. To have your information removed, we recommend requesting removal directly through your county’s website.
| Date | Status | Borrower | Loan Amount |
|---|---|---|---|
| Previous Owner | $140,000 | ||
| Previous Owner | $35,000 | ||
| Previous Owner | $1,300 |
Tax History
We collect this data history from publicly available records. To have your information removed, we recommend requesting removal directly through your county’s website.
| Year | Tax Paid | Tax Assessment Tax Assessment Total Assessment is a certain percentage of the fair market value that is determined by local assessors to be the total taxable value of land and additions on the property. | Land | Improvement |
|---|---|---|---|---|
| 2025 | $2,581 | $164,600 | $23,000 | $141,600 |
| 2024 | $2,491 | $155,100 | $21,500 | $133,600 |
| 2023 | $2,416 | $141,700 | $20,500 | $121,200 |
| 2022 | $2,625 | $139,500 | $18,600 | $120,900 |
| 2021 | $2,567 | $135,800 | $16,900 | $118,900 |
| 2020 | $1,957 | $100,200 | $16,900 | $83,300 |
| 2019 | $1,887 | $95,900 | $16,900 | $79,000 |
| 2018 | $1,750 | $88,900 | $16,900 | $72,000 |
| 2017 | $1,752 | $89,100 | $13,500 | $75,600 |
| 2016 | $1,557 | $79,200 | $13,500 | $65,700 |
| 2015 | $1,308 | $66,500 | $13,500 | $53,000 |
Map
- 536-538 Union St
- 540-542 Union St
- 683 State St
- 658 Union St
- 148-150 Cedar St
- 64 Thompson St
- 101 Mulberry St Unit G3
- 101 Mulberry St Unit 113
- 101 Mulberry St Unit 314
- S/S aka 0 Brigham St
- 93 Thompson St
- 54 Ridgewood Place
- 48 Madison Ave
- 157 Lebanon St
- 199 Eastern Ave
- 1030 Worthington St
- 38 Byers St
- 70 Temple St Unit 1
- 229 Central St
- 36-38 Chapel St
- 34 Quincy St Unit 1
- 30 Quincy St Unit 2
- 30 Quincy St Unit 1
- 30 Quincy St
- 24-26 Quincy St
- 24 Quincy St Unit 26
- 33 Quincy St Unit 1
- 35 Quincy St Unit 2
- 33 Quincy St
- 39 Quincy St
- 529 Union St Unit 1r
- 23 Quincy St
- 18 Quincy St Unit 22
- 91 Orleans St
- 93 Orleans St Unit 93
- 48 Quincy St Unit 50
- 519 Union St
- 97 Orleans St Unit 97
- 52 Quincy St Unit 56
- 13 Orleans Ct
Ask me questions while you tour the home.