
Landlord's Agent in 2023
C. Andrew Battinelli
C. Andrew Battinelli
(617) 633-2634
Estimated Value: $760,000 - $856,552
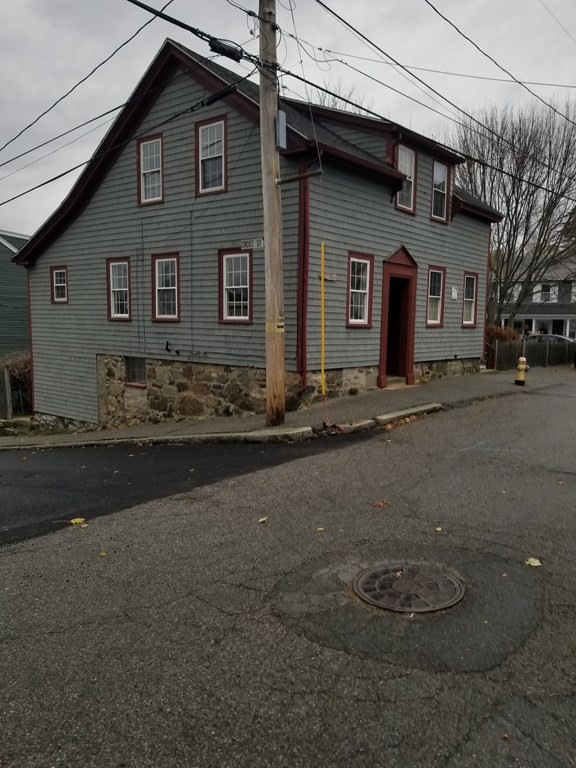
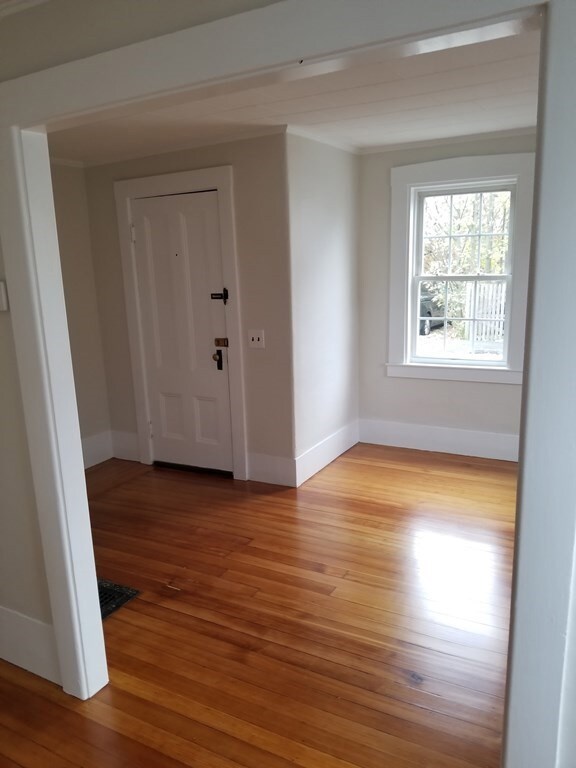
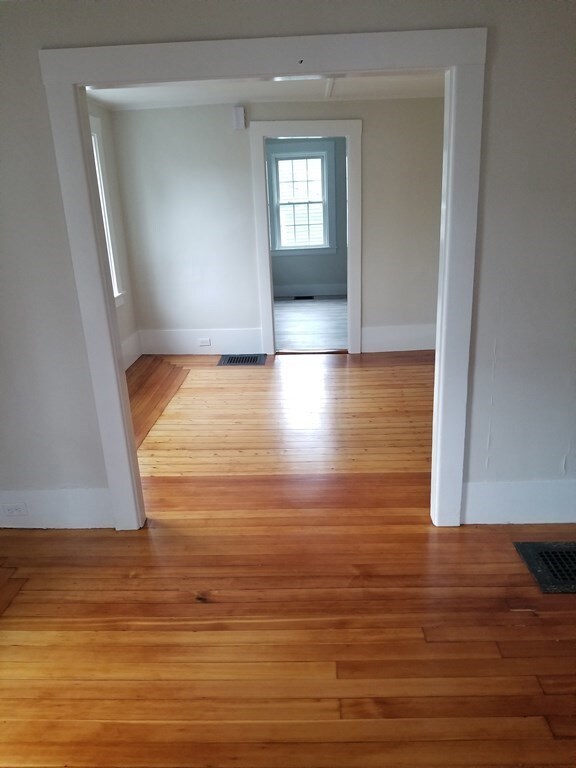
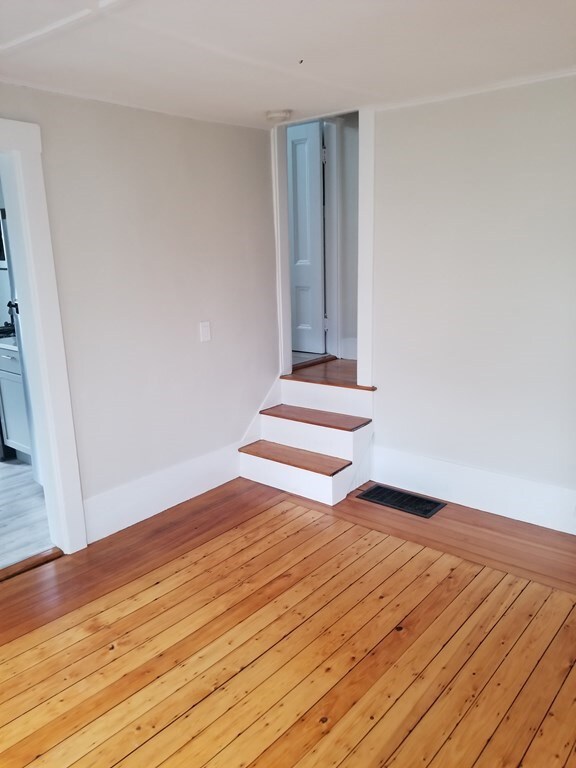
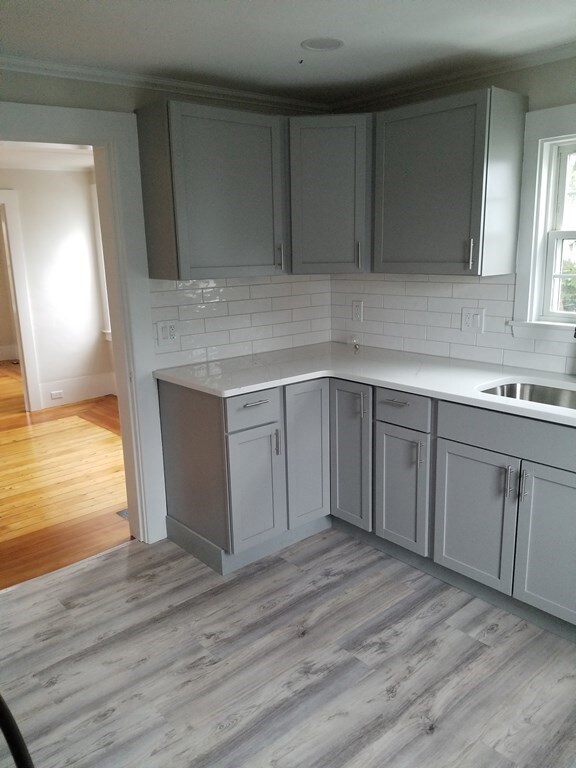
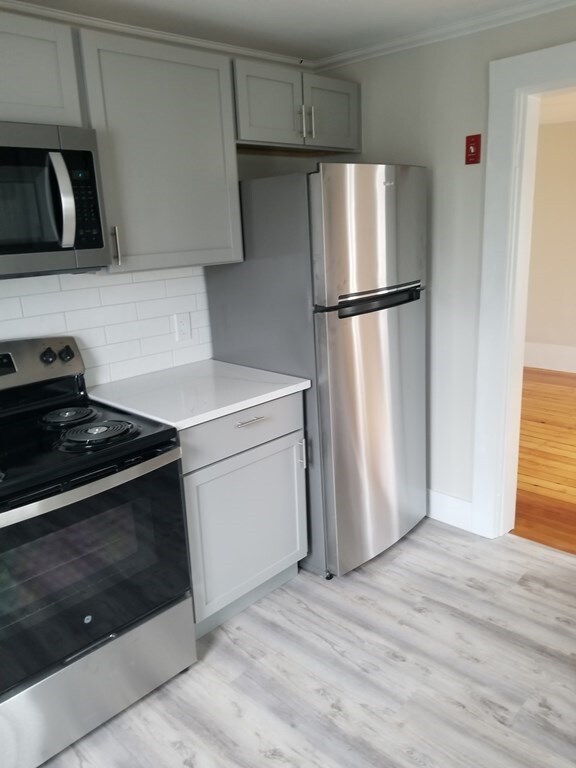
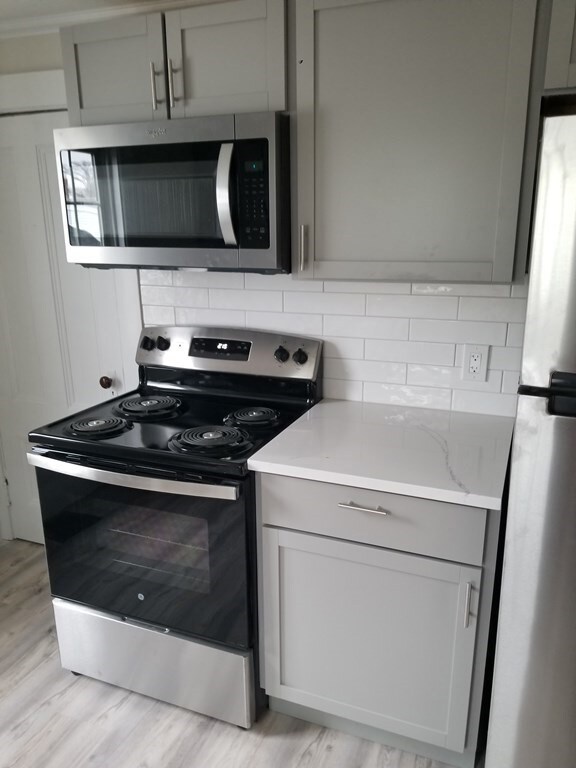
Enjoy living in a newly renovated sunny and spacious 1690 Antique bilevel with two bedrooms on a quiet side street. This charming freshly painted apartment has refinished fir and hard pine floors, a new kitchen with brand new cabinets, flooring and appliances including a stainless refrigerator, dishwasher, electric stove/oven, and built-in microwave. The countertops are quartz. The unit has a living room, dining room, and a new bathroom, freshly painted with updated fixtures, toilet and vanity. There is tandem parking for 2 cars. The yard is shared with one other apartment and offers plenty of space and shade. The apartment also has central air. The location is great within walking distance to downtown shopping, restaurants, schools and the beach. Tenant pays for oil heat, gas hot water and electricity. First, last and security deposit required as well as three references. No smoking. No pets.
| Date | Buyer | Sale Price | Title Company |
|---|---|---|---|
| Murtagh Declan S | $835,000 | None Available | |
| Murtagh Declan S | $835,000 | None Available | |
| Pappas Peter M | $433,600 | -- | |
| Pappas Peter M | $433,600 | -- |
| Date | Status | Borrower | Loan Amount |
|---|---|---|---|
| Open | Murtagh Declan S | $626,250 | |
| Closed | Murtagh Declan S | $626,250 | |
| Previous Owner | Pappas Peter M | $325,200 |
| Date | Event | Price | List to Sale | Price per Sq Ft |
|---|---|---|---|---|
| 03/01/2023 03/01/23 | Rented | $2,200 | 0.0% | -- |
| 02/20/2023 02/20/23 | Under Contract | -- | -- | -- |
| 01/05/2023 01/05/23 | Price Changed | $2,200 | -12.0% | $3 / Sq Ft |
| 12/02/2022 12/02/22 | For Rent | $2,500 | -- | -- |
| Year | Tax Paid | Tax Assessment Tax Assessment Total Assessment is a certain percentage of the fair market value that is determined by local assessors to be the total taxable value of land and additions on the property. | Land | Improvement |
|---|---|---|---|---|
| 2025 | $7,134 | $788,300 | $515,900 | $272,400 |
| 2024 | $7,294 | $814,100 | $561,700 | $252,400 |
| 2023 | $6,349 | $634,900 | $435,600 | $199,300 |
| 2022 | $6,156 | $585,200 | $372,600 | $212,600 |
| 2021 | $5,679 | $545,000 | $332,400 | $212,600 |
| 2020 | $5,769 | $555,200 | $378,300 | $176,900 |
| 2019 | $5,347 | $497,900 | $321,000 | $176,900 |
| 2018 | $5,360 | $486,400 | $309,500 | $176,900 |
| 2017 | $5,103 | $463,500 | $286,600 | $176,900 |
| 2016 | $4,915 | $442,800 | $263,700 | $179,100 |
| 2015 | $4,801 | $433,300 | $252,200 | $181,100 |
| 2014 | $3,818 | $344,300 | $229,300 | $115,000 |
Landlord's Agent in 2023
C. Andrew Battinelli
C. Andrew Battinelli
(617) 633-2634
Source: MLS Property Information Network (MLS PIN)
MLS Number: 73062414
APN: MARB-000109-000052
Disclaimer: Certain information contained herein is derived from information provided by parties other than Homes.com. All information provided is deemed reliable, but is not guaranteed to be accurate and should be independently verified.
![]() The property listing data and information, or the Images, set forth herein were provided to MLS Property Information Network, Inc. from third party sources, including sellers, lessors and public records, and were compiled by MLS Property Information Network, Inc. The property listing data and information, and the Images, are for the personal, non-commercial use of consumers having a good faith interest in purchasing or leasing listed properties of the type displayed to them and may not be used for any purpose other than to identify prospective properties which such consumers may have a good faith interest in purchasing or leasing. MLS Property Information Network, Inc. and its subscribers disclaim any and all representations and warranties as to the accuracy of the property listing data and information, or as to the accuracy of any of the Images, set forth herein.
The property listing data and information, or the Images, set forth herein were provided to MLS Property Information Network, Inc. from third party sources, including sellers, lessors and public records, and were compiled by MLS Property Information Network, Inc. The property listing data and information, and the Images, are for the personal, non-commercial use of consumers having a good faith interest in purchasing or leasing listed properties of the type displayed to them and may not be used for any purpose other than to identify prospective properties which such consumers may have a good faith interest in purchasing or leasing. MLS Property Information Network, Inc. and its subscribers disclaim any and all representations and warranties as to the accuracy of the property listing data and information, or as to the accuracy of any of the Images, set forth herein.