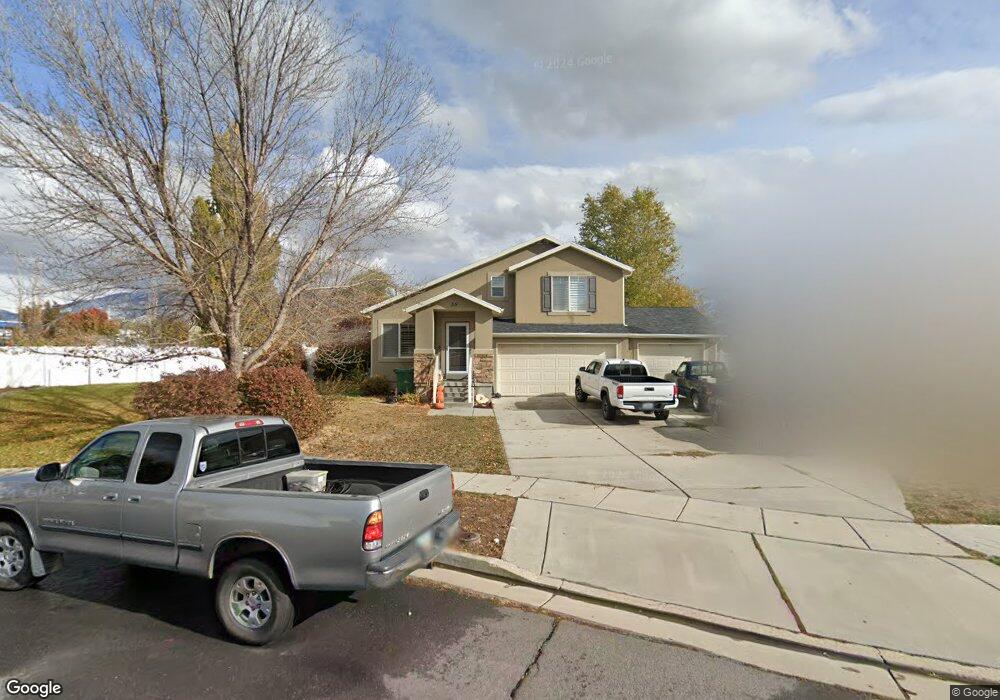
35 S 1125 W Layton, UT 84041
Estimated Value: $596,000 - $772,000
3
Beds
3
Baths
2,907
Sq Ft
$226/Sq Ft
Est. Value
About This Home
This home is located at 35 S 1125 W, Layton, UT 84041 and is currently estimated at $655,637, approximately $225 per square foot. 35 S 1125 W is a home located in Davis County with nearby schools including Layton Elementary School, Fairfield Junior High School, and Layton High School.
Ownership History
Date
Name
Owned For
Owner Type
Purchase Details
Closed on
Oct 1, 2008
Sold by
National Transfer Services Llc
Bought by
Waters Troy D and Waters Jody A
Current Estimated Value
Home Financials for this Owner
Home Financials are based on the most recent Mortgage that was taken out on this home.
Original Mortgage
$213,750
Outstanding Balance
$141,560
Interest Rate
6.43%
Mortgage Type
Purchase Money Mortgage
Estimated Equity
$514,077
Purchase Details
Closed on
Aug 16, 2005
Sold by
Park Homes Inc
Bought by
Sommer Eric J and Sommer Stacy K
Home Financials for this Owner
Home Financials are based on the most recent Mortgage that was taken out on this home.
Original Mortgage
$38,780
Interest Rate
5.12%
Mortgage Type
Stand Alone Second
Purchase Details
Closed on
Feb 11, 2004
Sold by
Rkt Holding Co Inc
Bought by
Park Homes Inc
Home Financials for this Owner
Home Financials are based on the most recent Mortgage that was taken out on this home.
Original Mortgage
$150,000
Interest Rate
5.85%
Mortgage Type
Construction
Create a Home Valuation Report for This Property
The Home Valuation Report is an in-depth analysis detailing your home's value as well as a comparison with similar homes in the area
Home Values in the Area
Average Home Value in this Area
Purchase History
| Date | Buyer | Sale Price | Title Company |
|---|---|---|---|
| Waters Troy D | -- | Mountain View Title & Escrow | |
| National Transfer Services Llc | -- | Mountain View Title & Escrow | |
| Sommer Eric J | -- | First American Title | |
| Park Homes Inc | -- | Heritage West Title Insuranc |
Source: Public Records
Mortgage History
| Date | Status | Borrower | Loan Amount |
|---|---|---|---|
| Open | Waters Troy D | $213,750 | |
| Previous Owner | Sommer Eric J | $38,780 | |
| Previous Owner | Sommer Eric J | $155,120 | |
| Previous Owner | Park Homes Inc | $150,000 |
Source: Public Records
Tax History
| Year | Tax Paid | Tax Assessment Tax Assessment Total Assessment is a certain percentage of the fair market value that is determined by local assessors to be the total taxable value of land and additions on the property. | Land | Improvement |
|---|---|---|---|---|
| 2025 | $2,845 | $298,650 | $165,935 | $132,715 |
| 2024 | $2,741 | $289,850 | $171,756 | $118,094 |
| 2023 | $2,768 | $516,000 | $194,399 | $321,601 |
| 2022 | $3,027 | $306,350 | $105,168 | $201,182 |
| 2021 | $2,690 | $406,000 | $157,668 | $248,332 |
| 2020 | $2,451 | $355,000 | $136,885 | $218,115 |
| 2019 | $2,411 | $342,000 | $130,032 | $211,968 |
| 2018 | $2,191 | $312,000 | $115,168 | $196,832 |
| 2016 | $1,969 | $144,595 | $50,689 | $93,906 |
| 2015 | $1,886 | $131,505 | $50,689 | $80,816 |
| 2014 | $2,034 | $145,032 | $50,689 | $94,343 |
| 2013 | -- | $112,817 | $36,031 | $76,786 |
Source: Public Records
Map
Nearby Homes
- 933 W Gentile St
- 257 S 950 W
- 750 W Gentile St
- 383 S 950 W
- 1382 W 250 N
- 1107 W 450 S
- 298 Amber Ln
- 1115 W 550 S
- 1600 W 200 N
- 316 Amber Ln
- 418 W Gentile St
- 163 Cold Creek Way
- 37 N Swift Creek Dr
- 1354 W 725 S
- 526 King St Unit 2
- 361 W 50 N
- 355 W Gentile St
- 356 W 25 N
- 339 W 25 N Unit 6
- 1677 N 1600 W Unit 134
Your Personal Tour Guide
Ask me questions while you tour the home.