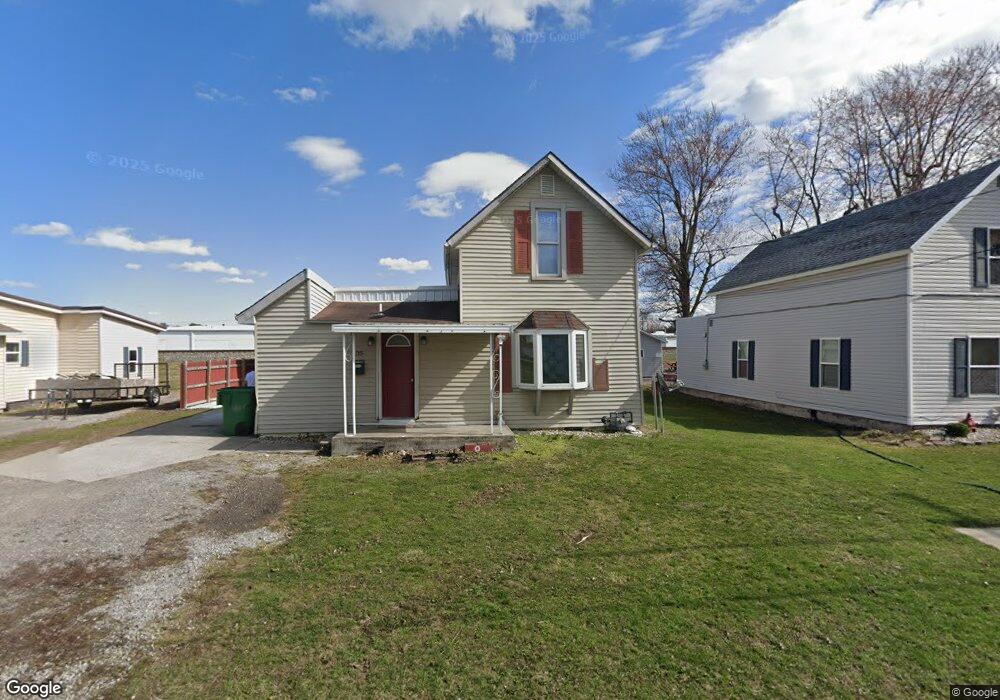
35 S Belmore St Leipsic, OH 45856
Estimated Value: $93,000 - $136,000
3
Beds
1
Bath
1,108
Sq Ft
$109/Sq Ft
Est. Value
About This Home
This home is located at 35 S Belmore St, Leipsic, OH 45856 and is currently estimated at $121,182, approximately $109 per square foot. 35 S Belmore St is a home located in Putnam County with nearby schools including Leipsic Elementary School, Leipsic High School, and St. Mary's Catholic School.
Ownership History
Date
Name
Owned For
Owner Type
Purchase Details
Closed on
Nov 20, 2016
Sold by
David Carol J
Bought by
Hernandez Maria and Hernandez Guillermo
Current Estimated Value
Purchase Details
Closed on
Nov 16, 2015
Sold by
David Carol J
Bought by
Hernandez Maria and Hernandez Guillermo
Home Financials for this Owner
Home Financials are based on the most recent Mortgage that was taken out on this home.
Original Mortgage
$32,000
Interest Rate
3.82%
Mortgage Type
Seller Take Back
Purchase Details
Closed on
May 25, 2010
Sold by
Wells Fargo Bank N A
Bought by
David Carol J
Home Financials for this Owner
Home Financials are based on the most recent Mortgage that was taken out on this home.
Original Mortgage
$22,000
Interest Rate
5.13%
Mortgage Type
Purchase Money Mortgage
Purchase Details
Closed on
Dec 7, 2009
Sold by
Estrada Lisa M and Ramirez Lisa M
Bought by
Wells Fargo Bank Na
Create a Home Valuation Report for This Property
The Home Valuation Report is an in-depth analysis detailing your home's value as well as a comparison with similar homes in the area
Purchase History
| Date | Buyer | Sale Price | Title Company |
|---|---|---|---|
| Hernandez Maria | $42,000 | None Available | |
| Hernandez Maria | $42,000 | Attorney | |
| David Carol J | $14,000 | None Available | |
| Wells Fargo Bank Na | $30,000 | None Available |
Source: Public Records
Mortgage History
| Date | Status | Borrower | Loan Amount |
|---|---|---|---|
| Previous Owner | Hernandez Maria | $32,000 | |
| Previous Owner | David Carol J | $22,000 |
Source: Public Records
Tax History
| Year | Tax Paid | Tax Assessment Tax Assessment Total Assessment is a certain percentage of the fair market value that is determined by local assessors to be the total taxable value of land and additions on the property. | Land | Improvement |
|---|---|---|---|---|
| 2025 | $755 | $24,510 | $2,640 | $21,870 |
| 2024 | $772 | $24,340 | $2,640 | $21,700 |
| 2023 | $811 | $19,510 | $2,070 | $17,440 |
| 2022 | $796 | $19,510 | $2,069 | $17,441 |
| 2021 | $736 | $17,530 | $2,070 | $15,460 |
| 2020 | $733 | $13,830 | $1,840 | $11,990 |
| 2019 | $590 | $14,590 | $2,070 | $12,520 |
| 2018 | $571 | $14,590 | $2,070 | $12,520 |
| 2017 | $502 | $14,590 | $2,070 | $12,520 |
| 2016 | $502 | $13,830 | $1,840 | $11,990 |
| 2015 | $494 | $13,830 | $1,840 | $11,990 |
| 2014 | $483 | $13,830 | $1,840 | $11,990 |
| 2013 | $499 | $13,830 | $1,840 | $11,990 |
Source: Public Records
Map
Nearby Homes
- 43 S Belmore St
- 31 S Belmore St
- 47 S Belmore St
- 48 S Belmore St
- 29 S Belmore St
- 42 Belmore St
- 55 S Belmore St
- 42 S Belmore St
- 52 S Belmore St
- 58 S Belmore St
- 30 S Belmore St
- 64 S Belmore St
- 15 S Belmore St
- 24 S Belmore St
- 70 S Belmore St
- 16 S Belmore St
- 9 S Belmore St
- 25 S Commercial St
- 19 S Commercial St
- 3 S Belmore St
Your Personal Tour Guide
Ask me questions while you tour the home.