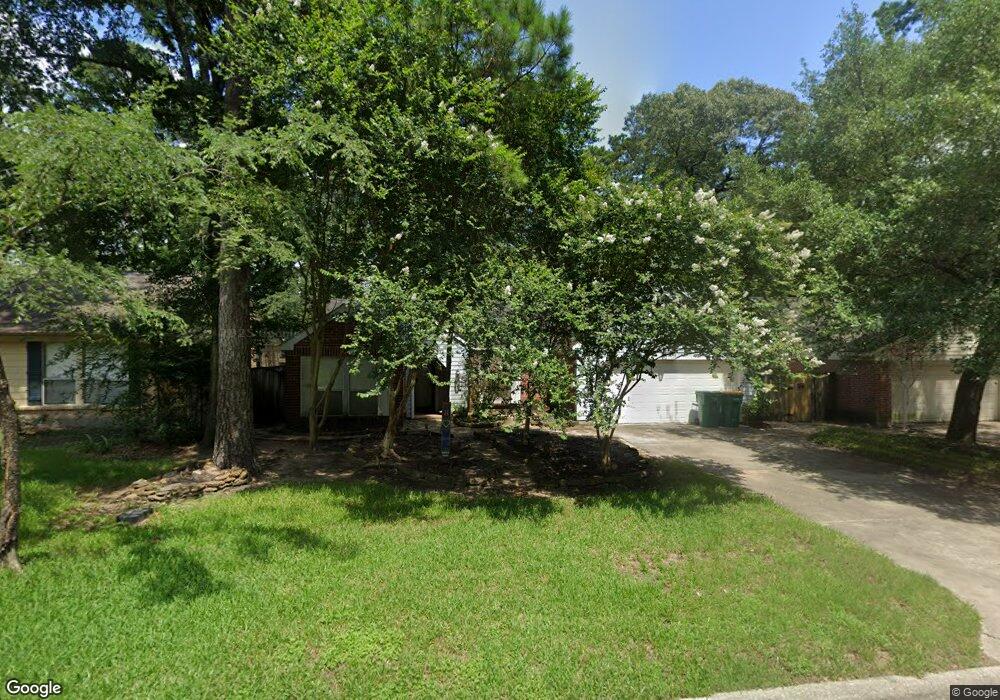
35 S White Pebble Ct Spring, TX 77380
Grogan's Mill NeighborhoodEstimated Value: $255,620 - $305,000
3
Beds
2
Baths
1,427
Sq Ft
$200/Sq Ft
Est. Value
About This Home
This home is located at 35 S White Pebble Ct, Spring, TX 77380 and is currently estimated at $285,655, approximately $200 per square foot. 35 S White Pebble Ct is a home located in Montgomery County with nearby schools including Hailey Elementary School, W.D Wilkerson Intermediate School, and Knox J High School.
Ownership History
Date
Name
Owned For
Owner Type
Purchase Details
Closed on
Aug 28, 2020
Sold by
Paul Fussell Jr Thomas
Bought by
Garner Leasa
Current Estimated Value
Home Financials for this Owner
Home Financials are based on the most recent Mortgage that was taken out on this home.
Original Mortgage
$171,000
Outstanding Balance
$139,756
Interest Rate
4.5%
Mortgage Type
New Conventional
Estimated Equity
$145,899
Purchase Details
Closed on
Jun 14, 1994
Sold by
Standley Leanne
Bought by
Fussell Thomas Paul
Home Financials for this Owner
Home Financials are based on the most recent Mortgage that was taken out on this home.
Original Mortgage
$66,000
Interest Rate
8.49%
Mortgage Type
Purchase Money Mortgage
Purchase Details
Closed on
Feb 25, 1991
Sold by
Galindo Armando
Bought by
Renee Fussell T and Renee L
Create a Home Valuation Report for This Property
The Home Valuation Report is an in-depth analysis detailing your home's value as well as a comparison with similar homes in the area
Home Values in the Area
Average Home Value in this Area
Purchase History
| Date | Buyer | Sale Price | Title Company |
|---|---|---|---|
| Garner Leasa | $227,430 | Texas American Title Company | |
| Fussell Thomas Paul | -- | -- | |
| Renee Fussell T | -- | -- |
Source: Public Records
Mortgage History
| Date | Status | Borrower | Loan Amount |
|---|---|---|---|
| Open | Garner Leasa | $171,000 | |
| Previous Owner | Fussell Thomas Paul | $66,000 |
Source: Public Records
Tax History Compared to Growth
Tax History
| Year | Tax Paid | Tax Assessment Tax Assessment Total Assessment is a certain percentage of the fair market value that is determined by local assessors to be the total taxable value of land and additions on the property. | Land | Improvement |
|---|---|---|---|---|
| 2025 | $3,626 | $160,000 | $50,000 | $110,000 |
| 2024 | $3,766 | $197,222 | $50,000 | $147,222 |
| 2023 | $3,766 | $203,810 | $50,000 | $153,810 |
| 2022 | $4,112 | $203,490 | $50,000 | $153,490 |
| 2021 | $3,160 | $144,840 | $12,600 | $132,240 |
| 2020 | $3,237 | $142,090 | $12,600 | $129,490 |
| 2019 | $3,291 | $139,790 | $12,600 | $127,190 |
| 2018 | $3,159 | $134,180 | $12,600 | $121,580 |
| 2017 | $3,198 | $134,180 | $12,600 | $121,580 |
| 2016 | $3,198 | $134,180 | $12,600 | $121,580 |
| 2015 | $2,939 | $134,180 | $12,600 | $121,580 |
| 2014 | $2,939 | $121,590 | $12,600 | $108,990 |
Source: Public Records
Map
Nearby Homes
- 25 N Summer Star Ct
- 26 N Summer Star Ct
- 36 N Rain Forest Ct
- 40 N Morningwood Ct
- 56 N Morningwood Ct
- 50 Dew Fall Ct
- 98 S Dreamweaver Cir
- 71 Timberspire Ln
- 62 Laughing Brook Ct
- 118 Angel Leaf Rd
- 190 N Tranquil Path Dr
- 1237 Pruitt Rd
- 1231 Pruitt Rd
- 713 Sawdust Rd
- 28 Sawmill Grove Ln
- 25225 Liberty Mill Dr
- 205 Grogans Point Rd
- 723 Shadowbrook Dr
- 25234 Calhoun Creek Dr
- 722 Shadowbrook Dr
- 31 S White Pebble Ct
- 39 S White Pebble Ct
- 32 S Brook Pebble Ct
- 28 S Brook Pebble Ct
- 27 S White Pebble Ct
- 43 S White Pebble Ct
- 36 S Brook Pebble Ct
- 34 S White Pebble Ct
- 24 S Brook Pebble Ct
- 30 S White Pebble Ct
- 38 S White Pebble Ct
- 23 S White Pebble Ct
- 26 S White Pebble Ct
- 47 S White Pebble Ct
- 20 S Brook Pebble Ct
- 42 S White Pebble Ct
- 22 S White Pebble Ct
- 19 S White Pebble Ct
- 16 S Brook Pebble Ct
- 46 S White Pebble Ct