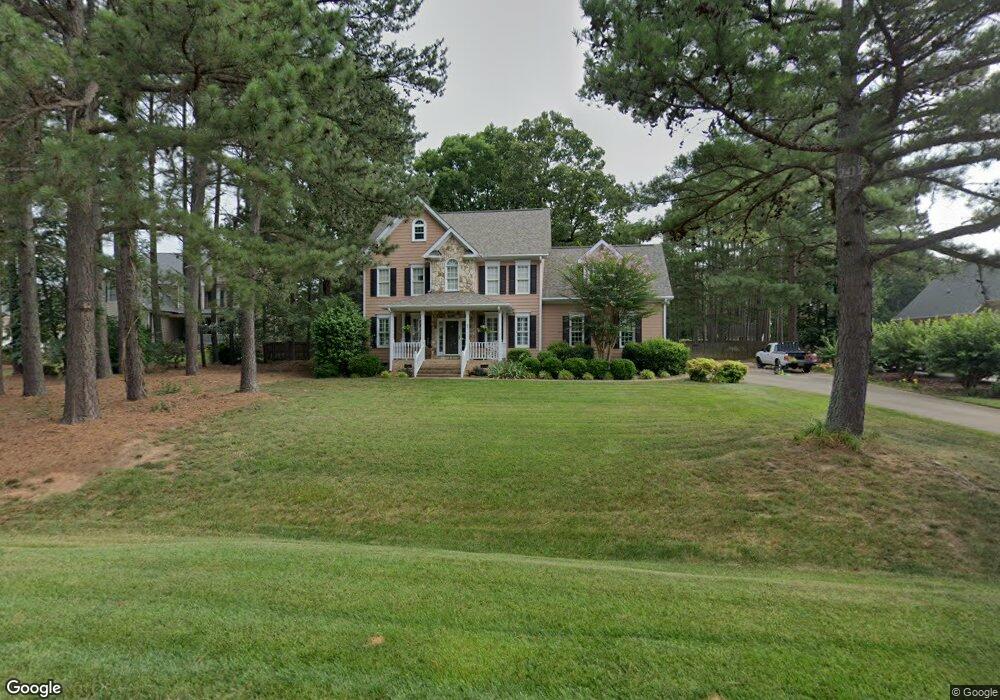
35 Scotts Pine Cir Wake Forest, NC 27587
Estimated Value: $595,296 - $628,000
3
Beds
3
Baths
2,323
Sq Ft
$265/Sq Ft
Est. Value
About This Home
This home is located at 35 Scotts Pine Cir, Wake Forest, NC 27587 and is currently estimated at $615,099, approximately $264 per square foot. 35 Scotts Pine Cir is a home located in Franklin County with nearby schools including Long Mill Elementary, Cedar Creek Middle, and Franklinton High School.
Ownership History
Date
Name
Owned For
Owner Type
Purchase Details
Closed on
Aug 10, 2012
Sold by
Mccormick Brian A and Mccormick Sarah P
Bought by
Kassebaum Bruce A and Kassebaum Karla M
Current Estimated Value
Home Financials for this Owner
Home Financials are based on the most recent Mortgage that was taken out on this home.
Original Mortgage
$244,489
Outstanding Balance
$160,616
Interest Rate
2.75%
Mortgage Type
FHA
Estimated Equity
$454,483
Purchase Details
Closed on
Dec 14, 2006
Sold by
Johnson William Frank and Johnson Mary Evelyn
Bought by
Mccormick Brian A and Mccormick Sarah P
Home Financials for this Owner
Home Financials are based on the most recent Mortgage that was taken out on this home.
Original Mortgage
$235,200
Interest Rate
6.29%
Mortgage Type
New Conventional
Purchase Details
Closed on
Jul 15, 2003
Bought by
Johnson William Frank and Johnson Ary
Create a Home Valuation Report for This Property
The Home Valuation Report is an in-depth analysis detailing your home's value as well as a comparison with similar homes in the area
Home Values in the Area
Average Home Value in this Area
Purchase History
| Date | Buyer | Sale Price | Title Company |
|---|---|---|---|
| Kassebaum Bruce A | $249,000 | None Available | |
| Mccormick Brian A | $294,000 | None Available | |
| Johnson William Frank | $238,000 | -- |
Source: Public Records
Mortgage History
| Date | Status | Borrower | Loan Amount |
|---|---|---|---|
| Open | Kassebaum Bruce A | $244,489 | |
| Previous Owner | Mccormick Brian A | $235,200 |
Source: Public Records
Tax History
| Year | Tax Paid | Tax Assessment Tax Assessment Total Assessment is a certain percentage of the fair market value that is determined by local assessors to be the total taxable value of land and additions on the property. | Land | Improvement |
|---|---|---|---|---|
| 2025 | $3,530 | $565,630 | $90,000 | $475,630 |
| 2024 | $3,465 | $565,630 | $90,000 | $475,630 |
| 2023 | $2,958 | $323,430 | $60,000 | $263,430 |
| 2022 | $2,948 | $323,430 | $60,000 | $263,430 |
| 2021 | $2,658 | $289,010 | $60,000 | $229,010 |
| 2020 | $2,684 | $290,200 | $60,000 | $230,200 |
| 2019 | $2,674 | $290,200 | $60,000 | $230,200 |
| 2018 | $2,655 | $290,200 | $60,000 | $230,200 |
| 2017 | $2,458 | $243,910 | $50,000 | $193,910 |
| 2016 | $2,543 | $243,910 | $50,000 | $193,910 |
| 2015 | $2,543 | $243,910 | $50,000 | $193,910 |
| 2014 | $2,390 | $243,910 | $50,000 | $193,910 |
Source: Public Records
Map
Nearby Homes
- 25 Westbourne Ln
- 65 Cherry Bark Dr
- 30 Cherry Bark Dr
- 35 Chestnut Oak Dr
- 15 Chestnut Oak Dr
- 105 Cherry Bark Dr
- 115 Cherry Bark Dr
- 25 Chestnut Oak Dr
- 95 Cherry Bark Dr
- 170 Cherry Bark Dr
- 125 Cherry Bark Dr
- 25 Sunflower Meadows Ln
- 115 Spanish Oak Dr
- 110 Spanish Oak Dr
- 35 Spanish Oak Dr
- 125 Spanish Oak Dr
- 190 Cherry Bark Dr
- 8616 Sunflower Meadows Ln
- 5 Anna Marie Way
- 8133 Holly Forest Rd
- 45 Scotts Pine Cir
- 25 Scotts Pine Cir
- 20 Scotts Pine Cir
- 55 Scotts Pine Cir
- 40 Scotts Pine Cir
- 100 Briarwood Place
- 15 Scotts Pine Cir
- 105 Briarwood Place
- 1853 Holden Rd
- 10 Scotts Pine Cir
- 15 Jackson Rd Unit 1
- 15 Jackson Rd
- 50 Scotts Pine Cir
- 65 Scotts Pine Cir
- 10 Jackson Rd Unit 43
- 10 Jackson Rd
- 110 Briarwood Place
- 60 Scotts Pine Cir
- 115 Briarwood Place
- 10 Traylee Dr
Your Personal Tour Guide
Ask me questions while you tour the home.