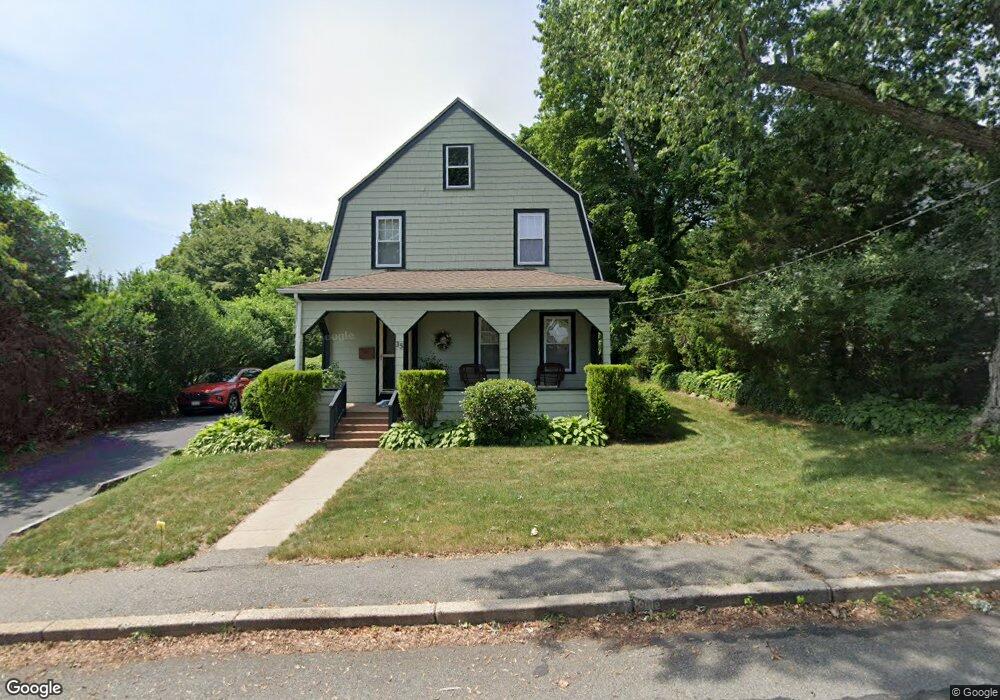
35 Shaw Rd Bridgewater, MA 02324
Estimated Value: $532,000 - $644,000
3
Beds
2
Baths
1,820
Sq Ft
$317/Sq Ft
Est. Value
About This Home
This home is located at 35 Shaw Rd, Bridgewater, MA 02324 and is currently estimated at $577,408, approximately $317 per square foot. 35 Shaw Rd is a home located in Plymouth County with nearby schools including Mitchell Elementary School, Williams Intermediate School, and Bridgewater Middle School.
Ownership History
Date
Name
Owned For
Owner Type
Purchase Details
Closed on
Mar 18, 2014
Sold by
Jeffries Frances M
Bought by
Shaw Road Nt
Current Estimated Value
Purchase Details
Closed on
Mar 30, 2000
Sold by
Ambrose Joseph P and Ambrose Sandra
Bought by
Moore-Jeffries Frances
Home Financials for this Owner
Home Financials are based on the most recent Mortgage that was taken out on this home.
Original Mortgage
$167,900
Interest Rate
8.4%
Mortgage Type
Purchase Money Mortgage
Create a Home Valuation Report for This Property
The Home Valuation Report is an in-depth analysis detailing your home's value as well as a comparison with similar homes in the area
Home Values in the Area
Average Home Value in this Area
Purchase History
| Date | Buyer | Sale Price | Title Company |
|---|---|---|---|
| Shaw Road Nt | -- | -- | |
| Moore-Jeffries Frances | $209,900 | -- |
Source: Public Records
Mortgage History
| Date | Status | Borrower | Loan Amount |
|---|---|---|---|
| Previous Owner | Moore-Jeffries Frances | $72,000 | |
| Previous Owner | Moore-Jeffries Frances | $162,100 | |
| Previous Owner | Moore-Jeffries Frances | $167,900 |
Source: Public Records
Tax History
| Year | Tax Paid | Tax Assessment Tax Assessment Total Assessment is a certain percentage of the fair market value that is determined by local assessors to be the total taxable value of land and additions on the property. | Land | Improvement |
|---|---|---|---|---|
| 2025 | $5,412 | $457,500 | $190,200 | $267,300 |
| 2024 | $5,263 | $433,500 | $181,100 | $252,400 |
| 2023 | $5,204 | $405,300 | $169,200 | $236,100 |
| 2022 | $4,680 | $326,800 | $148,500 | $178,300 |
| 2021 | $4,380 | $302,500 | $132,600 | $169,900 |
| 2020 | $4,329 | $293,900 | $127,500 | $166,400 |
| 2019 | $4,284 | $288,900 | $127,500 | $161,400 |
| 2018 | $4,115 | $270,900 | $117,900 | $153,000 |
| 2017 | $4,046 | $259,200 | $117,900 | $141,300 |
| 2016 | $3,918 | $252,100 | $115,600 | $136,500 |
| 2015 | $3,950 | $243,200 | $112,200 | $131,000 |
| 2014 | $3,871 | $238,200 | $108,900 | $129,300 |
Source: Public Records
Map
Nearby Homes
- 35 Leonard St Unit 3
- 130 Maple Ave
- 167 Spring St
- 47 Hale St
- 220 Bedford St Unit 32
- 51 Cottage St
- 180 Main St Unit D80
- 180 Main St Unit 1109
- 180 Main St Unit A15
- 180 Main St Unit B36
- 180 Main St Unit 4105
- 35 Nelson Dr
- 5 Heather Ln
- 302 Pleasant St
- 121 South Dr
- 459 High St
- 150 Prattown Ln
- 225 Whitman St
- 425 Laurel St
- 580 Broad St Unit 2