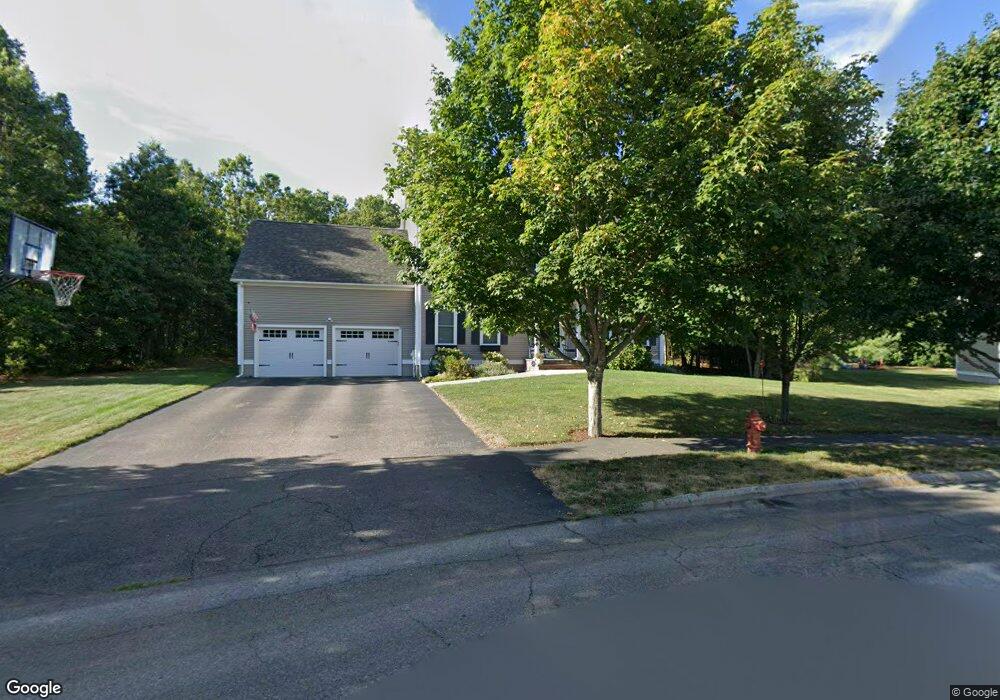
35 Shire Way Plainville, MA 02762
Estimated Value: $843,000 - $962,000
4
Beds
3
Baths
2,464
Sq Ft
$362/Sq Ft
Est. Value
About This Home
This home is located at 35 Shire Way, Plainville, MA 02762 and is currently estimated at $892,124, approximately $362 per square foot. 35 Shire Way is a home with nearby schools including Anna Ware Jackson School and Beatrice H. Wood Elementary School.
Ownership History
Date
Name
Owned For
Owner Type
Purchase Details
Closed on
Jan 29, 2010
Sold by
Walnut Hill Estates Ll
Bought by
Damadio Robert M and Damadio Erin C
Current Estimated Value
Home Financials for this Owner
Home Financials are based on the most recent Mortgage that was taken out on this home.
Original Mortgage
$417,000
Outstanding Balance
$274,877
Interest Rate
4.95%
Mortgage Type
Purchase Money Mortgage
Estimated Equity
$617,247
Create a Home Valuation Report for This Property
The Home Valuation Report is an in-depth analysis detailing your home's value as well as a comparison with similar homes in the area
Home Values in the Area
Average Home Value in this Area
Purchase History
| Date | Buyer | Sale Price | Title Company |
|---|---|---|---|
| Damadio Robert M | $461,940 | -- |
Source: Public Records
Mortgage History
| Date | Status | Borrower | Loan Amount |
|---|---|---|---|
| Open | Damadio Robert M | $417,000 |
Source: Public Records
Tax History Compared to Growth
Tax History
| Year | Tax Paid | Tax Assessment Tax Assessment Total Assessment is a certain percentage of the fair market value that is determined by local assessors to be the total taxable value of land and additions on the property. | Land | Improvement |
|---|---|---|---|---|
| 2025 | $93 | $808,300 | $275,800 | $532,500 |
| 2024 | $8,783 | $731,900 | $251,600 | $480,300 |
| 2023 | $8,538 | $684,100 | $251,600 | $432,500 |
| 2022 | $8,380 | $597,300 | $239,500 | $357,800 |
| 2021 | $8,264 | $562,200 | $258,100 | $304,100 |
| 2020 | $8,057 | $548,100 | $258,100 | $290,000 |
| 2019 | $7,710 | $515,000 | $239,500 | $275,500 |
| 2018 | $7,583 | $503,500 | $228,000 | $275,500 |
| 2017 | $7,572 | $504,800 | $245,700 | $259,100 |
| 2016 | $7,270 | $490,200 | $245,700 | $244,500 |
| 2015 | $7,338 | $475,900 | $209,700 | $266,200 |
| 2014 | $7,161 | $478,700 | $209,700 | $269,000 |
Source: Public Records
Map
Nearby Homes