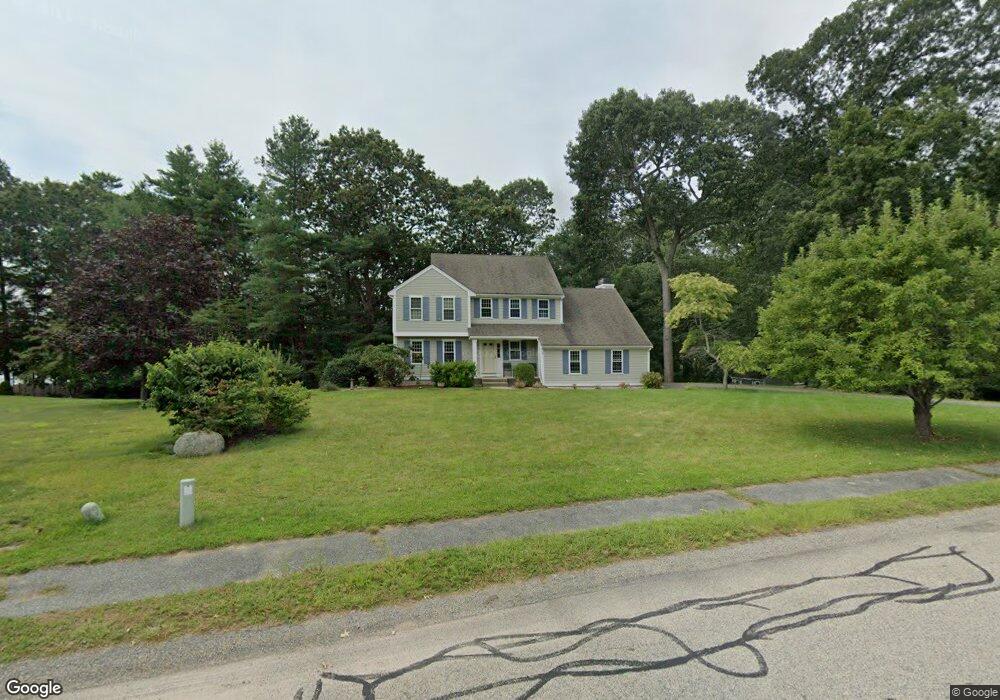
35 Shores Edge Pembroke, MA 02359
Estimated Value: $735,000 - $1,190,000
3
Beds
3
Baths
2,122
Sq Ft
$429/Sq Ft
Est. Value
About This Home
This home is located at 35 Shores Edge, Pembroke, MA 02359 and is currently estimated at $910,253, approximately $428 per square foot. 35 Shores Edge is a home located in Plymouth County with nearby schools including Pembroke High School and Cardinal Cushing Centers.
Ownership History
Date
Name
Owned For
Owner Type
Purchase Details
Closed on
Jan 27, 2025
Sold by
Avery Elisabeth M
Bought by
Elisabeth M Avery Ret and Avery
Current Estimated Value
Purchase Details
Closed on
Aug 20, 1993
Sold by
Spring Hill Rt and Gregory
Bought by
Avery Francis J and Avery Elizabeth M
Home Financials for this Owner
Home Financials are based on the most recent Mortgage that was taken out on this home.
Original Mortgage
$168,500
Interest Rate
7.11%
Mortgage Type
Purchase Money Mortgage
Create a Home Valuation Report for This Property
The Home Valuation Report is an in-depth analysis detailing your home's value as well as a comparison with similar homes in the area
Home Values in the Area
Average Home Value in this Area
Purchase History
| Date | Buyer | Sale Price | Title Company |
|---|---|---|---|
| Elisabeth M Avery Ret | -- | None Available | |
| Elisabeth M Avery Ret | -- | None Available | |
| Avery Francis J | $235,000 | -- |
Source: Public Records
Mortgage History
| Date | Status | Borrower | Loan Amount |
|---|---|---|---|
| Previous Owner | Avery Francis J | $168,500 |
Source: Public Records
Tax History Compared to Growth
Tax History
| Year | Tax Paid | Tax Assessment Tax Assessment Total Assessment is a certain percentage of the fair market value that is determined by local assessors to be the total taxable value of land and additions on the property. | Land | Improvement |
|---|---|---|---|---|
| 2025 | $8,777 | $730,200 | $358,300 | $371,900 |
| 2024 | $8,698 | $723,000 | $352,600 | $370,400 |
| 2023 | $8,218 | $646,100 | $325,300 | $320,800 |
| 2022 | $7,698 | $544,000 | $259,200 | $284,800 |
| 2021 | $7,706 | $528,500 | $253,500 | $275,000 |
| 2020 | $7,583 | $523,300 | $253,500 | $269,800 |
| 2019 | $7,290 | $499,300 | $242,400 | $256,900 |
| 2018 | $7,228 | $485,400 | $242,400 | $243,000 |
| 2017 | $6,809 | $450,900 | $209,700 | $241,200 |
| 2016 | $6,727 | $440,800 | $199,500 | $241,300 |
| 2015 | $6,123 | $415,400 | $175,200 | $240,200 |
Source: Public Records
Map
Nearby Homes