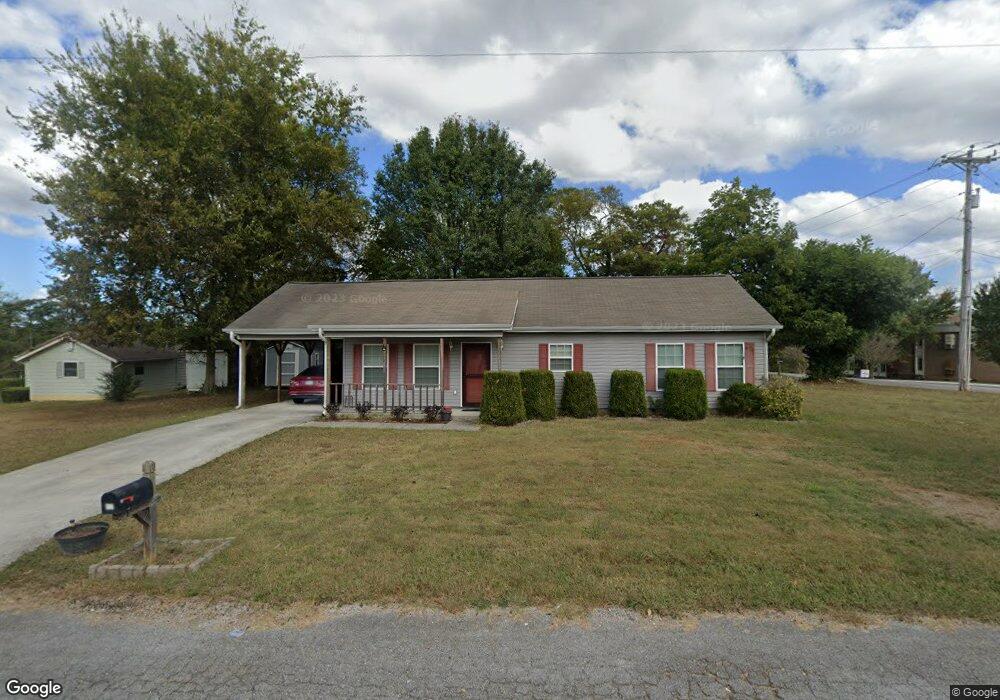
35 Short St Ringgold, GA 30736
Estimated Value: $215,026 - $261,000
Studio
--
Bath
1,125
Sq Ft
$211/Sq Ft
Est. Value
About This Home
This home is located at 35 Short St, Ringgold, GA 30736 and is currently estimated at $237,507, approximately $211 per square foot. 35 Short St is a home with nearby schools including Ringgold Primary School, Ringgold Elementary School, and Ringgold Middle School.
Ownership History
Date
Name
Owned For
Owner Type
Purchase Details
Closed on
Apr 11, 2011
Sold by
Henderson James Earl
Bought by
Finney Leroy
Current Estimated Value
Home Financials for this Owner
Home Financials are based on the most recent Mortgage that was taken out on this home.
Original Mortgage
$110,362
Outstanding Balance
$75,215
Interest Rate
4.85%
Mortgage Type
New Conventional
Estimated Equity
$162,292
Purchase Details
Closed on
Nov 2, 2009
Sold by
Loveberry Raquel
Bought by
Warthan Charles
Purchase Details
Closed on
Sep 10, 2009
Sold by
Erby Levester and Erby Mamie
Bought by
Henderson James Earl and Henderson Henley, Mark
Purchase Details
Closed on
Oct 23, 1997
Sold by
Heard Terry
Bought by
Erby Levester and Erby Mamie
Purchase Details
Closed on
Dec 16, 1996
Sold by
Christopher Ethel and A J
Bought by
Heard Terry
Create a Home Valuation Report for This Property
The Home Valuation Report is an in-depth analysis detailing your home's value as well as a comparison with similar homes in the area
Home Values in the Area
Average Home Value in this Area
Purchase History
| Date | Buyer | Sale Price | Title Company |
|---|---|---|---|
| Finney Leroy | $106,500 | -- | |
| Warthan Charles | $35,000 | -- | |
| Henderson James Earl | $13,000 | -- | |
| Erby Levester | $2,500 | -- | |
| Heard Terry | $3,000 | -- |
Source: Public Records
Mortgage History
| Date | Status | Borrower | Loan Amount |
|---|---|---|---|
| Open | Warthan Charles | $110,362 |
Source: Public Records
Tax History
| Year | Tax Paid | Tax Assessment Tax Assessment Total Assessment is a certain percentage of the fair market value that is determined by local assessors to be the total taxable value of land and additions on the property. | Land | Improvement |
|---|---|---|---|---|
| 2025 | $1,536 | $86,230 | $14,000 | $72,230 |
| 2024 | $1,784 | $74,780 | $5,757 | $69,023 |
| 2023 | $1,388 | $56,207 | $5,757 | $50,450 |
| 2022 | $1,105 | $45,119 | $5,757 | $39,362 |
| 2021 | $1,042 | $45,119 | $5,757 | $39,362 |
| 2020 | $1,073 | $40,877 | $5,757 | $35,120 |
| 2019 | $1,008 | $39,823 | $5,757 | $34,066 |
| 2018 | $1,085 | $39,001 | $4,935 | $34,066 |
| 2017 | $1,014 | $38,215 | $4,935 | $33,280 |
| 2016 | $974 | $35,215 | $4,935 | $30,280 |
| 2015 | -- | $35,215 | $4,935 | $30,280 |
| 2014 | -- | $35,215 | $4,935 | $30,280 |
| 2013 | -- | $35,214 | $4,934 | $30,280 |
Source: Public Records
Map
Nearby Homes
- 20 Ridge St
- 153 Willowind Ln
- 55 Condo Cir
- 401 Bluff View Dr
- 204 Old County Rd
- 0 Inman St
- 463 Cotter St
- 1653 Clearview Dr
- 65 Thorncrest Dr
- 1 Forest Dr
- Lot 2 Forest Dr
- 54 Hidden Trace Dr
- 17 Bama Ln
- 25 Bama Ln
- 9112 Highway 41
- 0 Clearview Dr Unit 1522993
- 180 Creeks Bend Dr
- 66 Angel Oak Way
- 413 Live Oak Rd
- 39 Joyce Ct
Your Personal Tour Guide
Ask me questions while you tour the home.