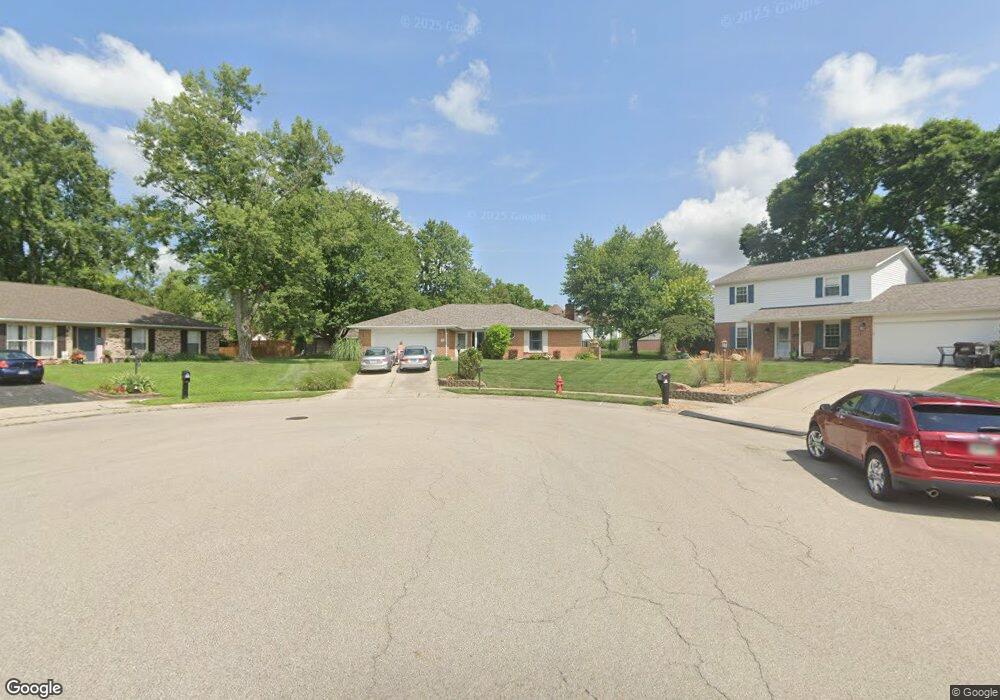
35 Southridge Ct Springboro, OH 45066
Estimated Value: $325,000 - $348,000
3
Beds
2
Baths
1,912
Sq Ft
$177/Sq Ft
Est. Value
About This Home
This home is located at 35 Southridge Ct, Springboro, OH 45066 and is currently estimated at $338,830, approximately $177 per square foot. 35 Southridge Ct is a home located in Warren County with nearby schools including Clearcreek Elementary School, Springboro Intermediate School, and Dennis Elementary School.
Ownership History
Date
Name
Owned For
Owner Type
Purchase Details
Closed on
Jun 20, 2002
Sold by
Hall Beth
Bought by
Benner Michael
Current Estimated Value
Home Financials for this Owner
Home Financials are based on the most recent Mortgage that was taken out on this home.
Original Mortgage
$140,300
Outstanding Balance
$59,573
Interest Rate
6.87%
Mortgage Type
New Conventional
Estimated Equity
$279,257
Purchase Details
Closed on
Feb 24, 1998
Sold by
Butler John H
Bought by
Hall Beth A
Home Financials for this Owner
Home Financials are based on the most recent Mortgage that was taken out on this home.
Original Mortgage
$67,000
Interest Rate
6.99%
Mortgage Type
New Conventional
Purchase Details
Closed on
Jun 14, 1988
Sold by
Malott Malott and Malott Charles L
Bought by
Butler Butler and Butler John H
Purchase Details
Closed on
Aug 12, 1986
Sold by
Stauder Stauder and Stauder Marie V
Bought by
Malott Malott and Malott Charles L
Purchase Details
Closed on
Dec 28, 1981
Sold by
George Holland Constructi
Purchase Details
Closed on
Oct 28, 1980
Sold by
Gibraltar Construction Co
Purchase Details
Closed on
May 30, 1978
Sold by
Tri-Ohio Development Co
Purchase Details
Closed on
Mar 17, 1978
Sold by
Tri-Ohio Dev Co
Create a Home Valuation Report for This Property
The Home Valuation Report is an in-depth analysis detailing your home's value as well as a comparison with similar homes in the area
Home Values in the Area
Average Home Value in this Area
Purchase History
| Date | Buyer | Sale Price | Title Company |
|---|---|---|---|
| Benner Michael | $155,900 | -- | |
| Hall Beth A | $137,000 | -- | |
| Butler Butler | $116,900 | -- | |
| Malott Malott | -- | -- | |
| -- | $78,000 | -- | |
| -- | $14,800 | -- | |
| -- | $14,900 | -- | |
| -- | -- | -- |
Source: Public Records
Mortgage History
| Date | Status | Borrower | Loan Amount |
|---|---|---|---|
| Open | Benner Michael | $140,300 | |
| Previous Owner | Hall Beth A | $67,000 |
Source: Public Records
Tax History Compared to Growth
Tax History
| Year | Tax Paid | Tax Assessment Tax Assessment Total Assessment is a certain percentage of the fair market value that is determined by local assessors to be the total taxable value of land and additions on the property. | Land | Improvement |
|---|---|---|---|---|
| 2024 | $3,667 | $93,890 | $24,500 | $69,390 |
| 2023 | $3,220 | $75,624 | $16,520 | $59,104 |
| 2022 | $3,173 | $75,625 | $16,520 | $59,105 |
| 2021 | $2,953 | $75,625 | $16,520 | $59,105 |
| 2020 | $2,862 | $64,089 | $14,000 | $50,089 |
| 2019 | $2,639 | $64,089 | $14,000 | $50,089 |
| 2018 | $2,641 | $64,089 | $14,000 | $50,089 |
| 2017 | $2,495 | $54,523 | $12,096 | $42,427 |
| 2016 | $2,602 | $54,523 | $12,096 | $42,427 |
| 2015 | $2,608 | $54,523 | $12,096 | $42,427 |
| 2014 | $2,572 | $50,960 | $11,310 | $39,650 |
| 2013 | $2,570 | $63,100 | $14,000 | $49,100 |
Source: Public Records
Map
Nearby Homes
- 120 Clearview Dr
- 145 Cedar Hill Ln
- 120 Bramblebush Ln
- 375 Tamarack Trail
- The McPherson Plan at Wadestone - Designer Collection
- Winslow Plan at Wadestone - Masterpiece Collection
- Avery Plan at Wadestone - Designer Collection
- Emmett Plan at Wadestone - Designer Collection
- Rhodes Plan at Wadestone - Masterpiece Collection
- Carrington Plan at Wadestone - Designer Collection
- Winston Plan at Wadestone - Designer Collection
- Paxton Plan at Wadestone - Masterpiece Collection
- Calvin Plan at Wadestone - Designer Collection
- Magnolia Plan at Wadestone - Designer Collection
- Pearson Plan at Wadestone - Masterpiece Collection
- Blair Plan at Wadestone - Designer Collection
- Grandin Plan at Wadestone - Designer Collection
- Finley Plan at Wadestone - Masterpiece Collection
- Mitchell Plan at Wadestone - Masterpiece Collection
- Leland Plan at Wadestone - Masterpiece Collection
- 25 Southridge Ct
- 30 Southridge Ct
- 120 Springwood Dr
- 110 Springwood Dr
- 130 Springwood Dr
- 100 Springwood Dr
- 20 Southridge Ct
- 15 Southridge Ct
- 140 Springwood Dr
- 90 Springwood Dr
- 100 Bayberry Dr
- 70 Bayberry Dr
- 25 Clearview Dr
- 15 Clearview Dr
- 135 Springwood Dr
- 150 Springwood Dr
- 60 Bayberry Dr
- 80 Springwood Dr
- 125 Springwood Dr
- 110 Bayberry Dr