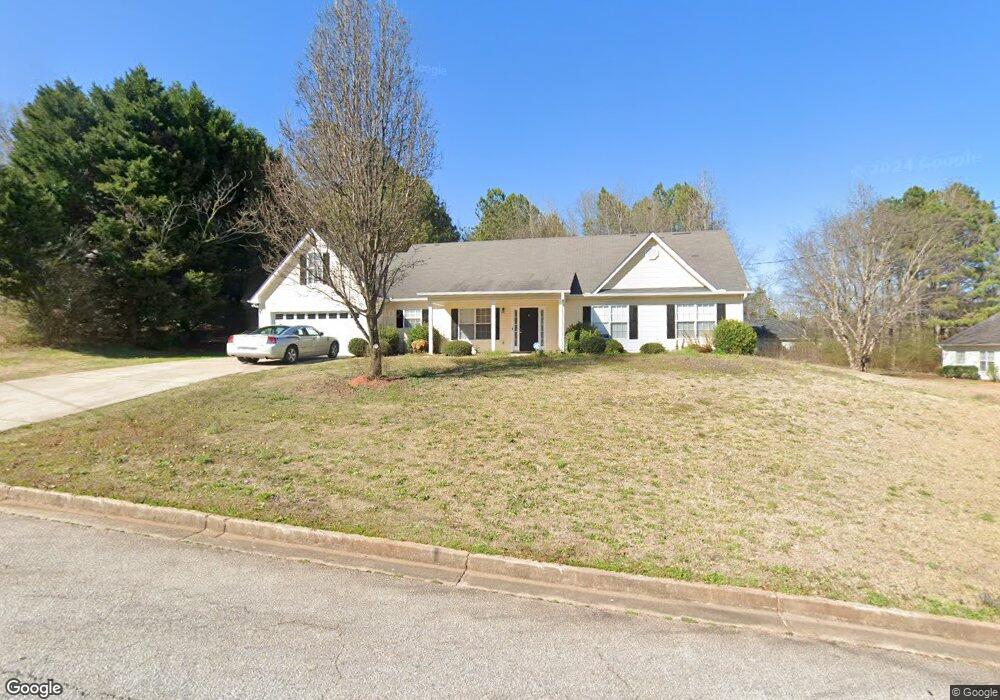
35 Spring Valley Trace Covington, GA 30016
Estimated Value: $273,000 - $288,000
3
Beds
2
Baths
1,856
Sq Ft
$151/Sq Ft
Est. Value
About This Home
This home is located at 35 Spring Valley Trace, Covington, GA 30016 and is currently estimated at $280,207, approximately $150 per square foot. 35 Spring Valley Trace is a home located in Newton County with nearby schools including Livingston Elementary School, Liberty Middle School, and Alcovy High School.
Ownership History
Date
Name
Owned For
Owner Type
Purchase Details
Closed on
Oct 21, 2020
Sold by
Hamilton Eric
Bought by
Boone Kecia
Current Estimated Value
Home Financials for this Owner
Home Financials are based on the most recent Mortgage that was taken out on this home.
Original Mortgage
$176,739
Outstanding Balance
$156,192
Interest Rate
2.8%
Mortgage Type
FHA
Estimated Equity
$124,015
Purchase Details
Closed on
Sep 29, 2011
Sold by
Deutsche Bank National Tru
Bought by
Hamilton Eric
Purchase Details
Closed on
Mar 1, 2011
Sold by
Negron Harry A and Negron Rosario
Bought by
Deutsche Bk Trust Co Amer 2006
Purchase Details
Closed on
Mar 29, 2002
Sold by
Saylor Angela R
Bought by
Negron Harry A and Negron Rosario
Home Financials for this Owner
Home Financials are based on the most recent Mortgage that was taken out on this home.
Original Mortgage
$120,844
Interest Rate
6.8%
Mortgage Type
FHA
Create a Home Valuation Report for This Property
The Home Valuation Report is an in-depth analysis detailing your home's value as well as a comparison with similar homes in the area
Home Values in the Area
Average Home Value in this Area
Purchase History
| Date | Buyer | Sale Price | Title Company |
|---|---|---|---|
| Boone Kecia | $180,000 | -- | |
| Hamilton Eric | $40,199 | -- | |
| Deutsche Bk Trust Co Amer 2006 | $87,000 | -- | |
| Negron Harry A | $121,800 | -- |
Source: Public Records
Mortgage History
| Date | Status | Borrower | Loan Amount |
|---|---|---|---|
| Open | Boone Kecia | $176,739 | |
| Previous Owner | Negron Harry A | $120,844 |
Source: Public Records
Tax History
| Year | Tax Paid | Tax Assessment Tax Assessment Total Assessment is a certain percentage of the fair market value that is determined by local assessors to be the total taxable value of land and additions on the property. | Land | Improvement |
|---|---|---|---|---|
| 2025 | $2,956 | $116,960 | $15,200 | $101,760 |
| 2024 | $2,786 | $108,200 | $15,200 | $93,000 |
| 2023 | $2,864 | $103,880 | $8,000 | $95,880 |
| 2022 | $2,455 | $88,800 | $8,000 | $80,800 |
| 2021 | $2,229 | $76,560 | $8,000 | $68,560 |
| 2020 | $2,300 | $67,120 | $8,000 | $59,120 |
| 2019 | $2,129 | $61,120 | $8,000 | $53,120 |
| 2018 | $1,785 | $50,680 | $6,400 | $44,280 |
| 2017 | $1,533 | $43,360 | $6,000 | $37,360 |
| 2016 | $869 | $24,000 | $3,800 | $20,200 |
| 2015 | $804 | $22,120 | $3,600 | $18,520 |
| 2014 | $721 | $19,760 | $0 | $0 |
Source: Public Records
Map
Nearby Homes
- 25 Shady Oaks Trail
- 125 Shelby Oaks Trail
- 20 Mountainview Ct Unit 2
- 0 Spring Hill Dr Unit 7725409
- 0 Spring Hill Dr Unit 10699182
- 115 Mountainview Dr
- 220 Harville Rd
- 240 Harville Rd
- 1752 Highway 162
- 10 Lamar Ln
- 10 Stoneview Cir
- 10 Barberry Cir
- 185 Mountain Ridge
- 0 Tempie Ln
- 674 Lower River Rd
- 711 Highway 162
- 0 Roseberry Rd
- 0 Chestnut Rd Unit 10696786
- 0 Chestnut Rd Unit 7723609
- 195 Twin Lakes Dr
- 45 Spring Valley Trace Unit 2
- 20 Spring Valley Trace
- 30 Spring Valley Trace Unit 2
- 30 Spring Valley Trace
- 25 Spring Valley Trace
- 10 Spring Valley Trace
- 15 Spring Valley Trace
- 11 Spring Valley Cove
- 11 Spring Valley Cove
- 40 Spring Valley Trace Unit 2
- 1371 Highway 162
- 4 Spring Valley Cove
- 4 Spring Valley Cove Unit 2
- 55 Spring Valley Trace
- 13 Spring Valley Cove Unit 2
- 50 Spring Valley Trace
- 6 Spring Valley Cove
- 1367 Highway 162
- 8 Spring Valley Cove
- 60 Spring Valley Trace
Your Personal Tour Guide
Ask me questions while you tour the home.