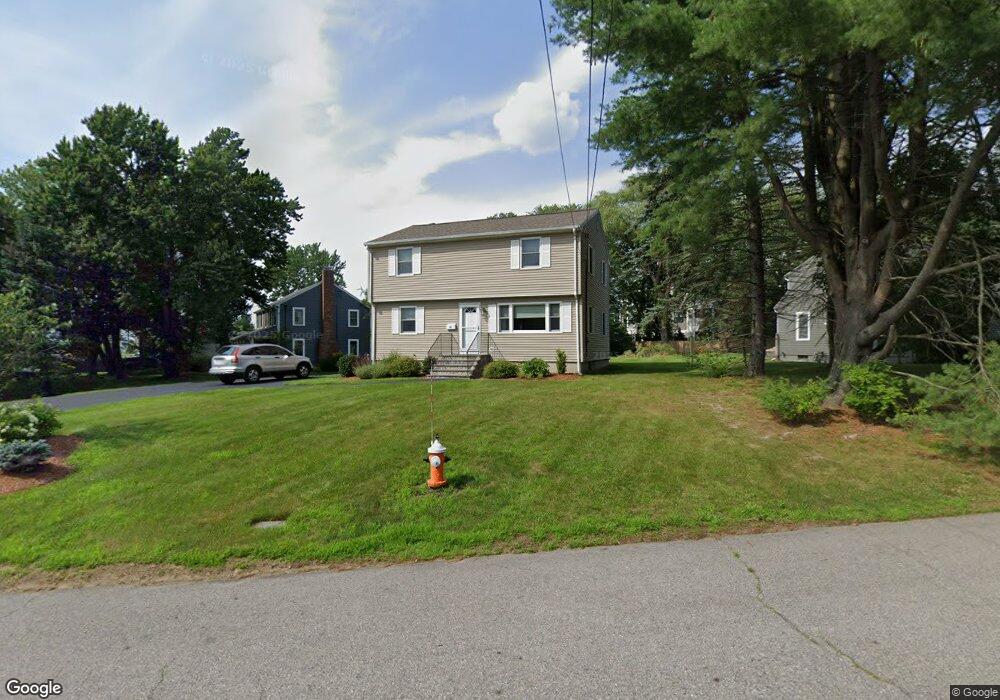
35 Surrey Dr North Andover, MA 01845
Estimated Value: $716,300 - $946,000
4
Beds
2
Baths
1,696
Sq Ft
$482/Sq Ft
Est. Value
About This Home
This home is located at 35 Surrey Dr, North Andover, MA 01845 and is currently estimated at $817,575, approximately $482 per square foot. 35 Surrey Dr is a home located in Essex County with nearby schools including Thomson Elementary School, North Andover Middle School, and North Andover High School.
Ownership History
Date
Name
Owned For
Owner Type
Purchase Details
Closed on
Mar 13, 2024
Sold by
Lampron Cathi J
Bought by
Jake Sean T and Jake Lampron
Current Estimated Value
Purchase Details
Closed on
Jun 21, 2018
Sold by
Lampron John J and Lampron Cathi J
Bought by
Lampron Cathi J
Purchase Details
Closed on
Apr 20, 1994
Sold by
Citron Bertha K
Bought by
Lampron John J
Create a Home Valuation Report for This Property
The Home Valuation Report is an in-depth analysis detailing your home's value as well as a comparison with similar homes in the area
Home Values in the Area
Average Home Value in this Area
Purchase History
| Date | Buyer | Sale Price | Title Company |
|---|---|---|---|
| Jake Sean T | -- | None Available | |
| Lampron Cathi J | -- | -- | |
| Lampron John J | $184,000 | -- |
Source: Public Records
Mortgage History
| Date | Status | Borrower | Loan Amount |
|---|---|---|---|
| Previous Owner | Lampron John J | $315,000 | |
| Previous Owner | Lampron John J | $260,000 |
Source: Public Records
Tax History Compared to Growth
Tax History
| Year | Tax Paid | Tax Assessment Tax Assessment Total Assessment is a certain percentage of the fair market value that is determined by local assessors to be the total taxable value of land and additions on the property. | Land | Improvement |
|---|---|---|---|---|
| 2025 | $7,102 | $630,700 | $342,500 | $288,200 |
| 2024 | $6,731 | $606,900 | $324,400 | $282,500 |
| 2023 | $6,393 | $522,300 | $274,000 | $248,300 |
| 2022 | $6,247 | $461,700 | $248,700 | $213,000 |
| 2021 | $5,971 | $421,400 | $225,300 | $196,100 |
| 2020 | $5,790 | $421,400 | $225,300 | $196,100 |
| 2019 | $5,651 | $421,400 | $225,300 | $196,100 |
| 2018 | $6,123 | $421,400 | $225,300 | $196,100 |
| 2017 | $5,119 | $358,500 | $186,900 | $171,600 |
| 2016 | $4,893 | $342,900 | $185,800 | $157,100 |
| 2015 | $4,867 | $338,200 | $179,300 | $158,900 |
Source: Public Records
Map
Nearby Homes
- 385 Sutton St
- 826 Osgood St
- 62 Brightwood Ave
- 29 Brightwood Ave
- 0 Great Pond Rd
- 12 Walker Rd Unit 6
- 148 Main St Unit A508
- 148 Main St Unit C538
- 148 Main St Unit A307
- 87 French Farm Rd
- 64 2nd St
- 68 Belmont St Unit 68
- 28 Riverview Blvd
- 1 Riverview Blvd Unit 3-8
- 1 Riverview Blvd Unit 2-203
- 13 Woodland St
- 68 Union St
- 115 Merrimack Rd
- 11 W Bradstreet Rd
- 52 Howard St