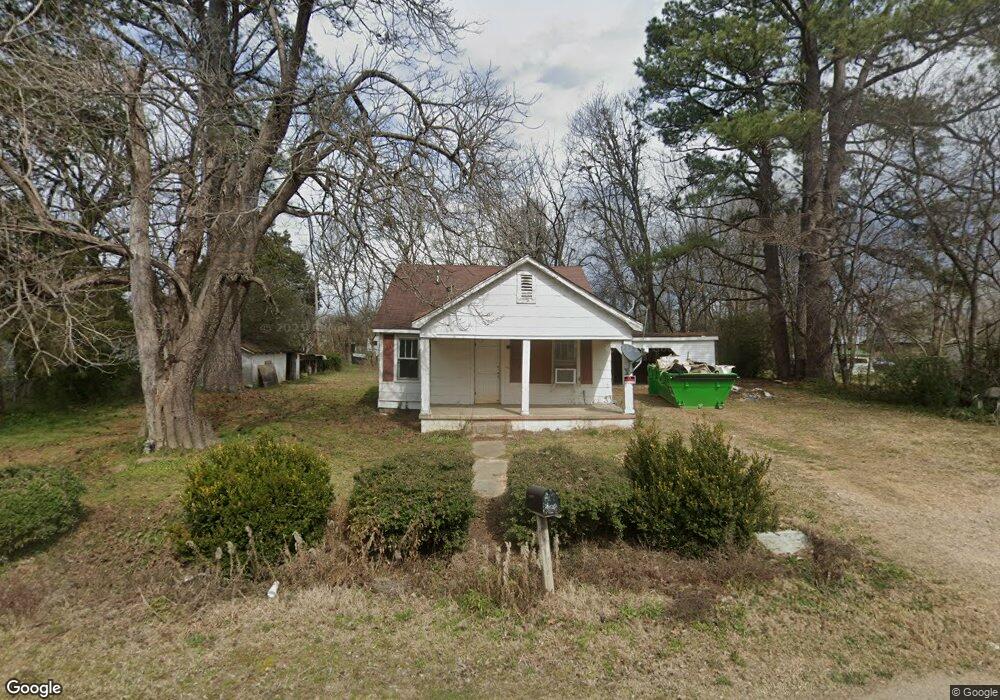
35 Sutton St Savannah, TN 38372
Estimated Value: $93,049 - $143,000
Studio
1
Bath
1,570
Sq Ft
$76/Sq Ft
Est. Value
About This Home
This home is located at 35 Sutton St, Savannah, TN 38372 and is currently estimated at $120,012, approximately $76 per square foot. 35 Sutton St is a home located in Hardin County with nearby schools including Hardin County High School, Hardin County Christian School, and Savannah Christian Academy.
Ownership History
Date
Name
Owned For
Owner Type
Purchase Details
Closed on
Oct 2, 2018
Sold by
Deaton Stacy
Bought by
Y & D Properties Llc
Current Estimated Value
Purchase Details
Closed on
Jul 16, 2018
Sold by
Young Christopher Lee
Bought by
Deaton Stacy
Purchase Details
Closed on
Mar 22, 1994
Bought by
Young Ronnie
Purchase Details
Closed on
Jul 25, 1990
Bought by
Young Ronnie
Purchase Details
Closed on
Mar 6, 1990
Bought by
Young Rabon and Young Ronnie
Purchase Details
Closed on
Mar 2, 1989
Bought by
Austin Nancy
Purchase Details
Closed on
Mar 11, 1985
Bought by
Oliver Velma
Create a Home Valuation Report for This Property
The Home Valuation Report is an in-depth analysis detailing your home's value as well as a comparison with similar homes in the area
Home Values in the Area
Average Home Value in this Area
Purchase History
We collect this data history from publicly available records. To have your information removed, we recommend requesting removal directly through your county’s website.
| Date | Buyer | Sale Price | Title Company |
|---|---|---|---|
| Y & D Properties Llc | -- | -- | |
| Deaton Stacy | -- | -- | |
| Young Ronnie | $2,500 | -- | |
| Young Ronnie | -- | -- | |
| Young Rabon | $7,300 | -- | |
| Austin Nancy | -- | -- | |
| Oliver Velma | -- | -- |
Source: Public Records
Tax History
| Year | Tax Paid | Tax Assessment Tax Assessment Total Assessment is a certain percentage of the fair market value that is determined by local assessors to be the total taxable value of land and additions on the property. | Land | Improvement |
|---|---|---|---|---|
| 2025 | $523 | $21,350 | $3,250 | $18,100 |
| 2024 | $523 | $21,350 | $3,250 | $18,100 |
| 2023 | $523 | $21,350 | $3,250 | $18,100 |
| 2022 | $403 | $14,600 | $3,075 | $11,525 |
| 2021 | $403 | $14,600 | $3,075 | $11,525 |
| 2020 | $403 | $14,600 | $3,075 | $11,525 |
| 2019 | $403 | $14,600 | $3,075 | $11,525 |
| 2018 | $393 | $14,600 | $3,075 | $11,525 |
| 2017 | $314 | $11,300 | $2,150 | $9,150 |
| 2016 | $314 | $11,300 | $2,150 | $9,150 |
| 2015 | $285 | $11,300 | $2,150 | $9,150 |
| 2014 | $276 | $10,950 | $2,150 | $8,800 |
Source: Public Records
Map
Nearby Homes
Your Personal Tour Guide
Ask me questions while you tour the home.