35 Thornton St Lagrange, GA 30241
Estimated Value: $102,000 - $122,145
2
Beds
1
Bath
1,384
Sq Ft
$81/Sq Ft
Est. Value
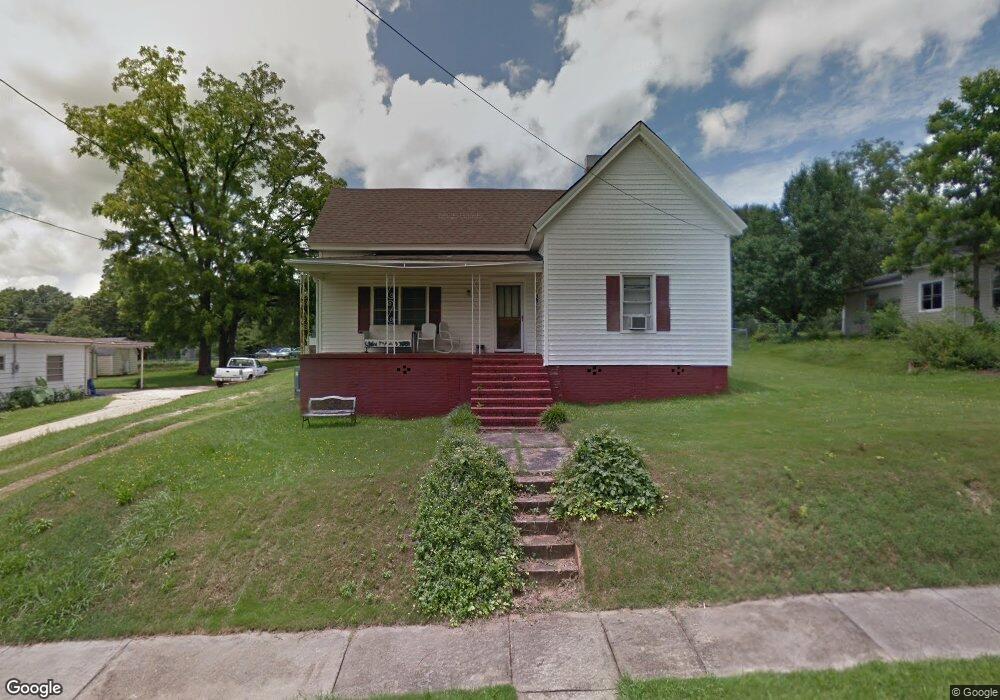
About This Home
This home is located at 35 Thornton St, Lagrange, GA 30241 and is currently estimated at $111,536, approximately $80 per square foot. 35 Thornton St is a home located in Troup County with nearby schools including Franklin Forest Elementary School, Hollis Hand Elementary School, and Ethel W. Kight Elementary School.
Ownership History
Date
Name
Owned For
Owner Type
Purchase Details
Closed on
Mar 28, 2018
Sold by
Brown Lynvel L
Bought by
Love Martha K
Current Estimated Value
Purchase Details
Closed on
Nov 29, 2017
Sold by
Brown Elizabeth D
Bought by
Brown Lynvel L
Purchase Details
Closed on
Jan 1, 1972
Sold by
Oneal
Bought by
Brown Lynvel and Brown Diane
Purchase Details
Closed on
Aug 1, 1964
Sold by
Pepperell
Bought by
Oneal
Create a Home Valuation Report for This Property
The Home Valuation Report is an in-depth analysis detailing your home's value as well as a comparison with similar homes in the area
Home Values in the Area
Average Home Value in this Area
Purchase History
| Date | Buyer | Sale Price | Title Company |
|---|---|---|---|
| Love Martha K | $55,000 | -- | |
| Brown Lynvel L | -- | -- | |
| Brown Lynvel | $8,000 | -- | |
| Oneal | -- | -- |
Source: Public Records
Tax History Compared to Growth
Tax History
| Year | Tax Paid | Tax Assessment Tax Assessment Total Assessment is a certain percentage of the fair market value that is determined by local assessors to be the total taxable value of land and additions on the property. | Land | Improvement |
|---|---|---|---|---|
| 2024 | $869 | $31,880 | $5,360 | $26,520 |
| 2023 | $749 | $27,480 | $5,360 | $22,120 |
| 2022 | $731 | $26,200 | $5,360 | $20,840 |
| 2021 | $696 | $23,080 | $3,040 | $20,040 |
| 2020 | $696 | $23,080 | $3,040 | $20,040 |
| 2019 | $594 | $19,700 | $3,060 | $16,640 |
| 2018 | $360 | $19,700 | $3,060 | $16,640 |
| 2017 | $360 | $19,700 | $3,060 | $16,640 |
| 2016 | $352 | $19,437 | $3,060 | $16,377 |
| 2015 | $352 | $19,437 | $3,060 | $16,377 |
| 2014 | $326 | $18,575 | $3,060 | $15,515 |
| 2013 | -- | $19,784 | $3,060 | $16,724 |
Source: Public Records
Map
Nearby Homes
- 5 Curran Ave
- 130 Clara Jean Ct
- 0 N Barnard Ave
- 15 Fulton St
- 113 Lenox Cir
- 305 Lenox Cir
- 105 Lenox Cir
- 101 Lenox Cir
- 227 River Meadow Dr Unit H14
- 231 River Meadow Dr
- 412 Sweetwood Ct Unit A36
- Coleman Plan at Crossvine Village
- 0 Mill Creek Pkwy Unit PHASE 5 10313564
- Beckman Plan at Crossvine Village
- 0 Mill Creek Pkwy Unit PHASE 4 10313585
- Fairfield Plan at Crossvine Village
- Broadmoor Plan at Crossvine Village
- Dover Plan at Crossvine Village
- 121 Ct
- 128 Shenandoah Ln Unit A67