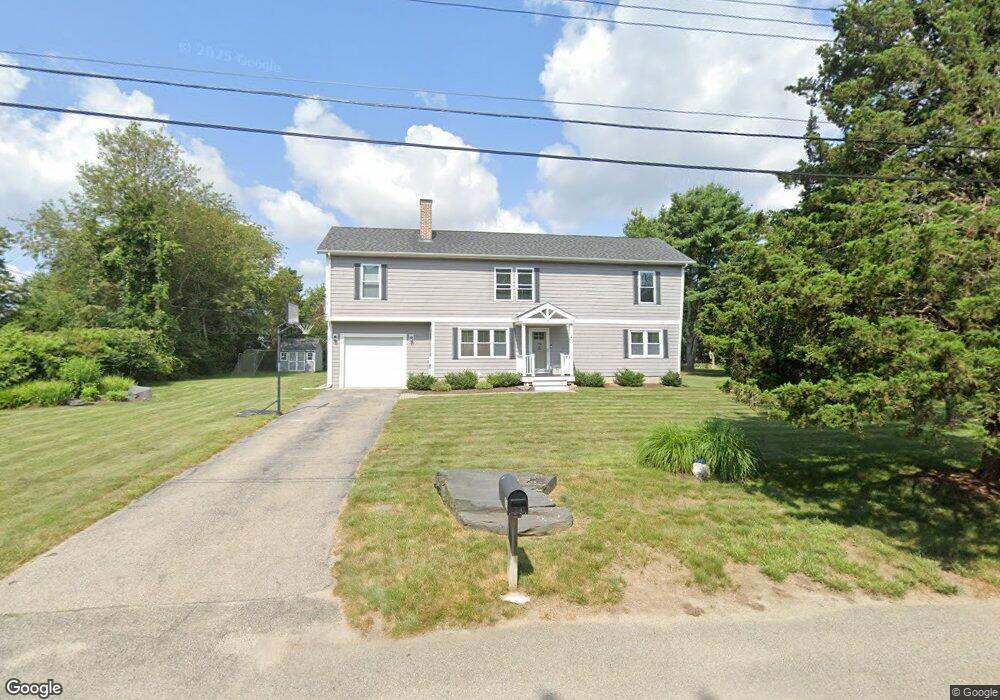
35 Top O the Mark Dr Jamestown, RI 02835
Jamestown Shores NeighborhoodEstimated Value: $827,000 - $1,012,478
2
Beds
1
Bath
1,008
Sq Ft
$899/Sq Ft
Est. Value
About This Home
This home is located at 35 Top O the Mark Dr, Jamestown, RI 02835 and is currently estimated at $905,870, approximately $898 per square foot. 35 Top O the Mark Dr is a home located in Newport County with nearby schools including Melrose Avenue School and Lawn Avenue School.
Ownership History
Date
Name
Owned For
Owner Type
Purchase Details
Closed on
Apr 26, 2024
Sold by
Tighe Jill E and Tighe Howard F
Bought by
Jill E & Howard F Tighe 2 and Tighe
Current Estimated Value
Purchase Details
Closed on
Aug 7, 2008
Sold by
Burton Philip K
Bought by
Tighe Howard and Tighe Jill
Home Financials for this Owner
Home Financials are based on the most recent Mortgage that was taken out on this home.
Original Mortgage
$322,452
Interest Rate
6.49%
Mortgage Type
Purchase Money Mortgage
Purchase Details
Closed on
Jun 30, 2003
Sold by
Tormey Robert and Tormey Mary
Bought by
Burton Philip and Burton Amy
Purchase Details
Closed on
Sep 17, 2002
Sold by
Gordon Margaret M
Bought by
Tormey Robert J
Create a Home Valuation Report for This Property
The Home Valuation Report is an in-depth analysis detailing your home's value as well as a comparison with similar homes in the area
Home Values in the Area
Average Home Value in this Area
Purchase History
| Date | Buyer | Sale Price | Title Company |
|---|---|---|---|
| Jill E & Howard F Tighe 2 | -- | None Available | |
| Jill E & Howard F Tighe 2 | -- | None Available | |
| Tighe Howard | $325,000 | -- | |
| Tighe Howard | $325,000 | -- | |
| Burton Philip | $294,000 | -- | |
| Burton Philip | $294,000 | -- | |
| Tormey Robert J | $231,000 | -- | |
| Tormey Robert J | $231,000 | -- |
Source: Public Records
Mortgage History
| Date | Status | Borrower | Loan Amount |
|---|---|---|---|
| Previous Owner | Tormey Robert J | $480,000 | |
| Previous Owner | Tormey Robert J | $307,280 | |
| Previous Owner | Tormey Robert J | $322,452 |
Source: Public Records
Tax History Compared to Growth
Tax History
| Year | Tax Paid | Tax Assessment Tax Assessment Total Assessment is a certain percentage of the fair market value that is determined by local assessors to be the total taxable value of land and additions on the property. | Land | Improvement |
|---|---|---|---|---|
| 2025 | $4,519 | $801,200 | $278,100 | $523,100 |
| 2024 | $4,069 | $567,500 | $210,700 | $356,800 |
| 2023 | $3,962 | $567,600 | $210,700 | $356,900 |
| 2022 | $3,854 | $567,600 | $210,700 | $356,900 |
| 2021 | $4,173 | $504,000 | $193,500 | $310,500 |
| 2020 | $4,067 | $504,000 | $193,500 | $310,500 |
| 2019 | $4,057 | $504,000 | $193,500 | $310,500 |
| 2018 | $3,703 | $418,400 | $174,100 | $244,300 |
| 2017 | $3,623 | $418,400 | $174,100 | $244,300 |
| 2016 | $3,590 | $418,400 | $174,100 | $244,300 |
| 2015 | $3,773 | $429,700 | $203,600 | $226,100 |
| 2014 | $2,744 | $313,600 | $203,600 | $110,000 |
Source: Public Records
Map
Nearby Homes
- 35 Top O' the Mark Dr
- 41 Top o Mark Dr
- 35 Top o Mark Dr
- 41 Top O' the Mark
- 29 Top o Mark Dr
- 28 Top O the Mark Dr
- 38 Top O the Mark Dr
- 59 Top o Mark Dr
- 28 Norman Rd
- 28 Top o Mark Dr
- 38 Top o Mark Dr
- 48 Top o Mark Dr
- 24 Norman Rd
- 38 Norman Rd
- 21 Top o Mark Dr
- 4 Nun Ave
- 22 Top o Mark Dr
- 44 Top O the Mark Dr
- 18 Norman Rd
- 18 Top o Mark Dr