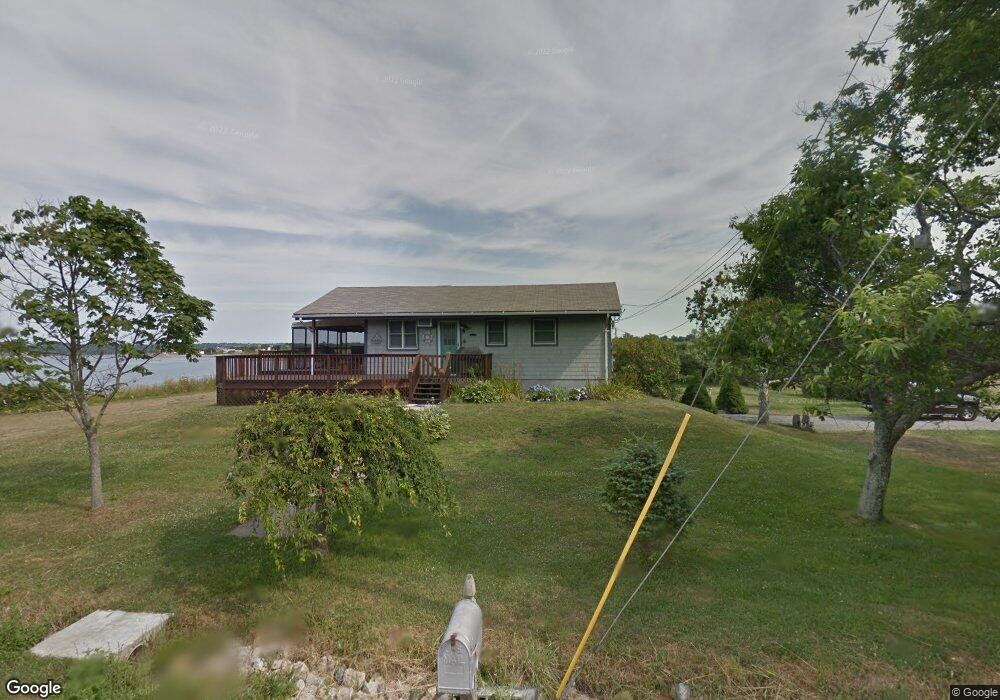
35 Town Way Little Compton, RI 02837
Estimated Value: $728,259 - $1,175,000
2
Beds
1
Bath
816
Sq Ft
$1,298/Sq Ft
Est. Value
About This Home
This home is located at 35 Town Way, Little Compton, RI 02837 and is currently estimated at $1,059,315, approximately $1,298 per square foot. 35 Town Way is a home located in Newport County with nearby schools including Wilbur & McMahon School.
Ownership History
Date
Name
Owned For
Owner Type
Purchase Details
Closed on
May 1, 2020
Sold by
Ranone Richard A and Ranone Kim M
Bought by
Kim M Ranone T M and Kim Ranone
Current Estimated Value
Purchase Details
Closed on
Apr 14, 2010
Sold by
Azevedo Gerald E and Azevedo Gail A
Bought by
Ranone Richard and Ranone Kim
Create a Home Valuation Report for This Property
The Home Valuation Report is an in-depth analysis detailing your home's value as well as a comparison with similar homes in the area
Home Values in the Area
Average Home Value in this Area
Purchase History
| Date | Buyer | Sale Price | Title Company |
|---|---|---|---|
| Kim M Ranone T M | -- | None Available | |
| Kim M Ranone T | -- | None Available | |
| Ranone Richard | $695,000 | -- | |
| Ranone Richard | $695,000 | -- |
Source: Public Records
Mortgage History
| Date | Status | Borrower | Loan Amount |
|---|---|---|---|
| Previous Owner | Ranone Richard | $260,000 | |
| Previous Owner | Ranone Richard | $384,437 |
Source: Public Records
Tax History
| Year | Tax Paid | Tax Assessment Tax Assessment Total Assessment is a certain percentage of the fair market value that is determined by local assessors to be the total taxable value of land and additions on the property. | Land | Improvement |
|---|---|---|---|---|
| 2025 | $4,517 | $943,000 | $748,200 | $194,800 |
| 2024 | $4,039 | $795,100 | $596,200 | $198,900 |
| 2023 | $3,944 | $795,100 | $596,200 | $198,900 |
| 2022 | $3,825 | $780,700 | $596,200 | $184,500 |
| 2021 | $3,974 | $657,900 | $518,300 | $139,600 |
| 2020 | $3,941 | $657,900 | $518,300 | $139,600 |
| 2019 | $3,901 | $657,900 | $518,300 | $139,600 |
| 2018 | $4,048 | $679,200 | $541,900 | $137,300 |
| 2016 | $3,851 | $679,200 | $541,900 | $137,300 |
| 2015 | $3,793 | $659,600 | $535,600 | $124,000 |
| 2014 | $3,720 | $659,600 | $535,600 | $124,000 |
Source: Public Records
Map
Nearby Homes
Your Personal Tour Guide
Ask me questions while you tour the home.