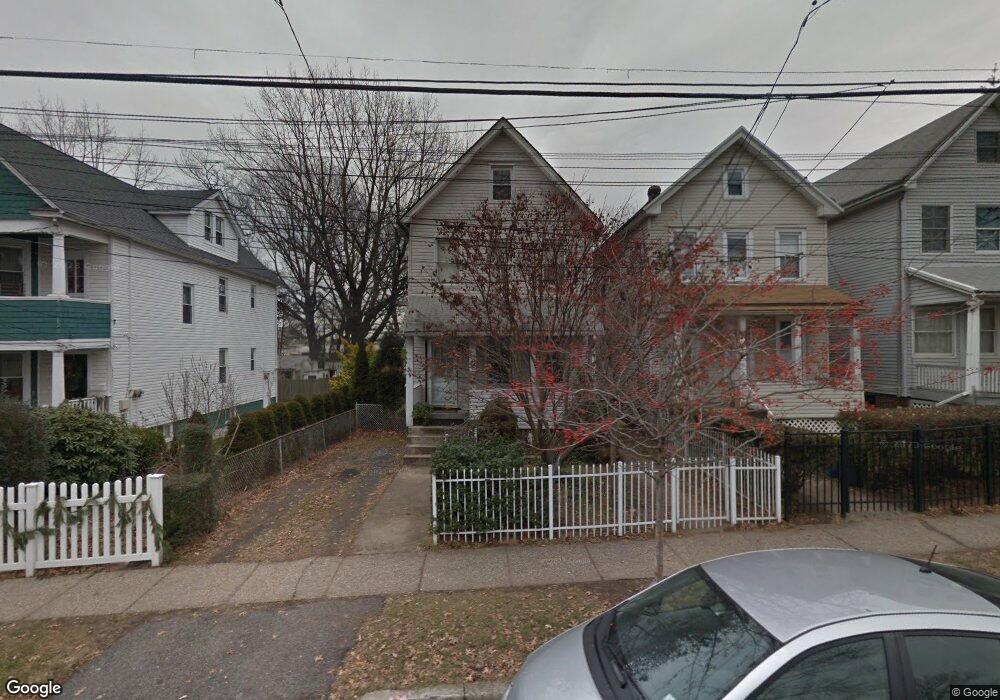
35 Trantor Place Staten Island, NY 10302
Port Richmond NeighborhoodEstimated Value: $460,000 - $669,000
2
Beds
2
Baths
1,344
Sq Ft
$413/Sq Ft
Est. Value
About This Home
This home is located at 35 Trantor Place, Staten Island, NY 10302 and is currently estimated at $554,554, approximately $412 per square foot. 35 Trantor Place is a home located in Richmond County with nearby schools including PS 21 Margaret Emery-Elm Park, I.S. 51 Edwin Markham, and Port Richmond High School.
Ownership History
Date
Name
Owned For
Owner Type
Purchase Details
Closed on
Aug 23, 1996
Sold by
Giallorenzo Thomas J and Giallorenzo Patrick A
Bought by
Giallorenzo Patrick and Giallorenzo Eleanor
Current Estimated Value
Create a Home Valuation Report for This Property
The Home Valuation Report is an in-depth analysis detailing your home's value as well as a comparison with similar homes in the area
Home Values in the Area
Average Home Value in this Area
Purchase History
| Date | Buyer | Sale Price | Title Company |
|---|---|---|---|
| Giallorenzo Patrick | $50,000 | -- |
Source: Public Records
Tax History Compared to Growth
Tax History
| Year | Tax Paid | Tax Assessment Tax Assessment Total Assessment is a certain percentage of the fair market value that is determined by local assessors to be the total taxable value of land and additions on the property. | Land | Improvement |
|---|---|---|---|---|
| 2025 | $2,902 | $31,920 | $6,016 | $25,904 |
| 2024 | $2,914 | $31,800 | $6,039 | $25,761 |
| 2023 | $2,903 | $20,494 | $6,340 | $14,154 |
| 2022 | $2,614 | $25,080 | $9,300 | $15,780 |
| 2021 | $2,576 | $26,460 | $9,300 | $17,160 |
| 2020 | $8,327 | $25,680 | $9,300 | $16,380 |
| 2019 | $5,863 | $22,620 | $9,300 | $13,320 |
| 2018 | $2,313 | $17,078 | $6,228 | $10,850 |
| 2017 | $2,642 | $16,112 | $8,056 | $8,056 |
| 2016 | $2,407 | $15,200 | $7,986 | $7,214 |
| 2015 | $2,163 | $14,340 | $7,740 | $6,600 |
| 2014 | $2,163 | $14,340 | $7,740 | $6,600 |
Source: Public Records
Map
Nearby Homes
- 98 Saint Josephs Ave
- 38 Laforge Ave
- 145 Clinton Place
- 162 John St
- 211 Morningstar Rd
- 28 Hooker Place
- 145 Morningside Ave Unit 2C
- 209 Nicholas Ave
- 11 Laforge Ave
- 469 Port Richmond Ave
- 231 Charles Ave
- 306 Morningstar Rd
- 152 Port Richmond Ave
- 322 Morningstar Rd
- 325 Pulaski Ave
- 327 Pulaski Ave
- 329 Pulaski Ave
- 331 Pulaski Ave
- 47 Montell St
- 28 Clinton Place
- 37 Trantor Place
- 31 Trantor Place
- 39 Trantor Place
- 29 Trantor Place
- 43 Trantor Place
- 23 Trantor Place
- 45 Trantor Place
- 21 Trantor Place
- 302 Nicholas Ave
- 304 Nicholas Ave
- 55 Trantor Place
- 300 Nicholas Ave
- 310 Nicholas Ave
- 51 Trantor Place
- 17 Trantor Place
- 294 Nicholas Ave
- 314 Nicholas Ave
- 290 Nicholas Ave
- 15 Trantor Place
- 57 Trantor Place