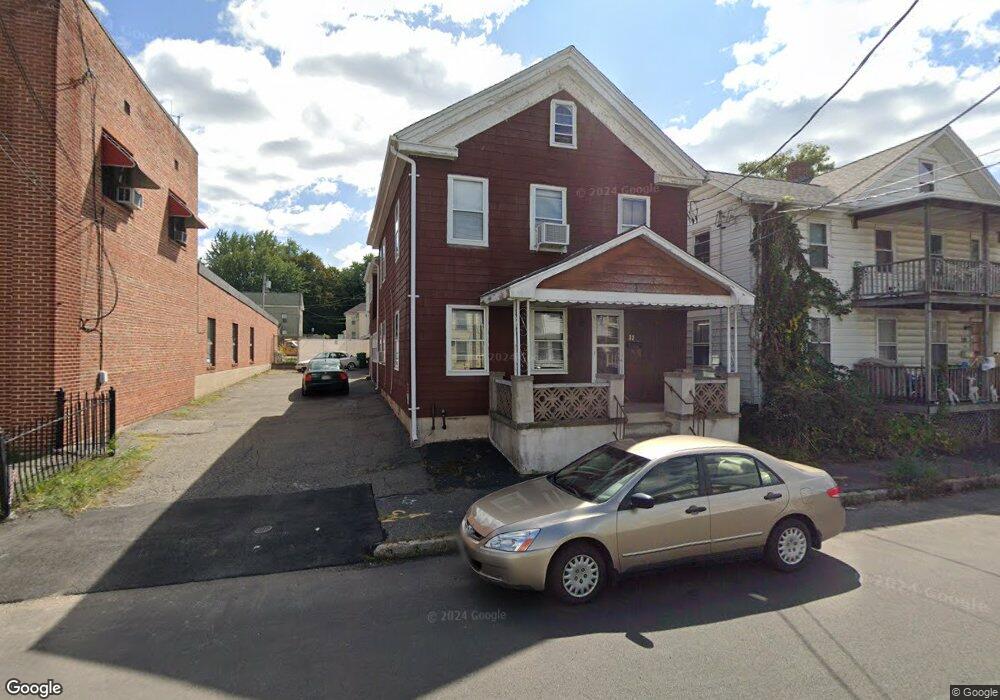
35 Tremont St Chicopee, MA 01013
Chicopee Center NeighborhoodEstimated Value: $258,848 - $326,000
6
Beds
2
Baths
2,124
Sq Ft
$133/Sq Ft
Est. Value
About This Home
This home is located at 35 Tremont St, Chicopee, MA 01013 and is currently estimated at $283,212, approximately $133 per square foot. 35 Tremont St is a home located in Hampden County with nearby schools including Bowe Elementary School, Fairview Middle School, and Chicopee High School.
Ownership History
Date
Name
Owned For
Owner Type
Purchase Details
Closed on
Dec 9, 2016
Sold by
Page Lucille
Bought by
Lopes Manny P and Haney Kayla M
Current Estimated Value
Home Financials for this Owner
Home Financials are based on the most recent Mortgage that was taken out on this home.
Original Mortgage
$73,910
Outstanding Balance
$60,270
Interest Rate
3.47%
Mortgage Type
New Conventional
Estimated Equity
$222,942
Create a Home Valuation Report for This Property
The Home Valuation Report is an in-depth analysis detailing your home's value as well as a comparison with similar homes in the area
Home Values in the Area
Average Home Value in this Area
Purchase History
| Date | Buyer | Sale Price | Title Company |
|---|---|---|---|
| Lopes Manny P | $77,800 | -- |
Source: Public Records
Mortgage History
| Date | Status | Borrower | Loan Amount |
|---|---|---|---|
| Open | Lopes Manny P | $73,910 |
Source: Public Records
Tax History
| Year | Tax Paid | Tax Assessment Tax Assessment Total Assessment is a certain percentage of the fair market value that is determined by local assessors to be the total taxable value of land and additions on the property. | Land | Improvement |
|---|---|---|---|---|
| 2025 | $3,252 | $214,500 | $50,500 | $164,000 |
| 2024 | $3,076 | $208,400 | $49,500 | $158,900 |
| 2023 | $2,877 | $189,900 | $45,000 | $144,900 |
| 2022 | $2,824 | $166,200 | $39,100 | $127,100 |
| 2021 | $2,686 | $152,500 | $35,600 | $116,900 |
| 2020 | $2,530 | $144,900 | $35,600 | $109,300 |
| 2019 | $2,901 | $142,000 | $35,600 | $106,400 |
| 2018 | $2,494 | $136,200 | $33,900 | $102,300 |
| 2017 | $2,678 | $154,700 | $39,200 | $115,500 |
| 2016 | $2,521 | $149,100 | $39,200 | $109,900 |
| 2015 | $2,366 | $134,900 | $39,200 | $95,700 |
| 2014 | $1,183 | $134,900 | $39,200 | $95,700 |
Source: Public Records
Map
Nearby Homes
- 27 Abbey St
- 0 School St
- 13 Beston St
- 21 Depot St
- 69 Beston St
- 248 Hampden St
- Lot 1 Marion St
- 2 Marion St
- 35 Lower Grape St
- 85 Orchard St
- 80 Brush Hill Ave Unit 61
- 0 Nelson St
- 325 Granby Rd
- 87 Blanchwood Ave
- 51 Beaumont Ave
- 86 Beaumont Ave
- 76 Joy St
- 61 Abbey Memorial Dr Unit 153
- 404 Brush Hill Ave
- 439 Oldfield Rd
Your Personal Tour Guide
Ask me questions while you tour the home.