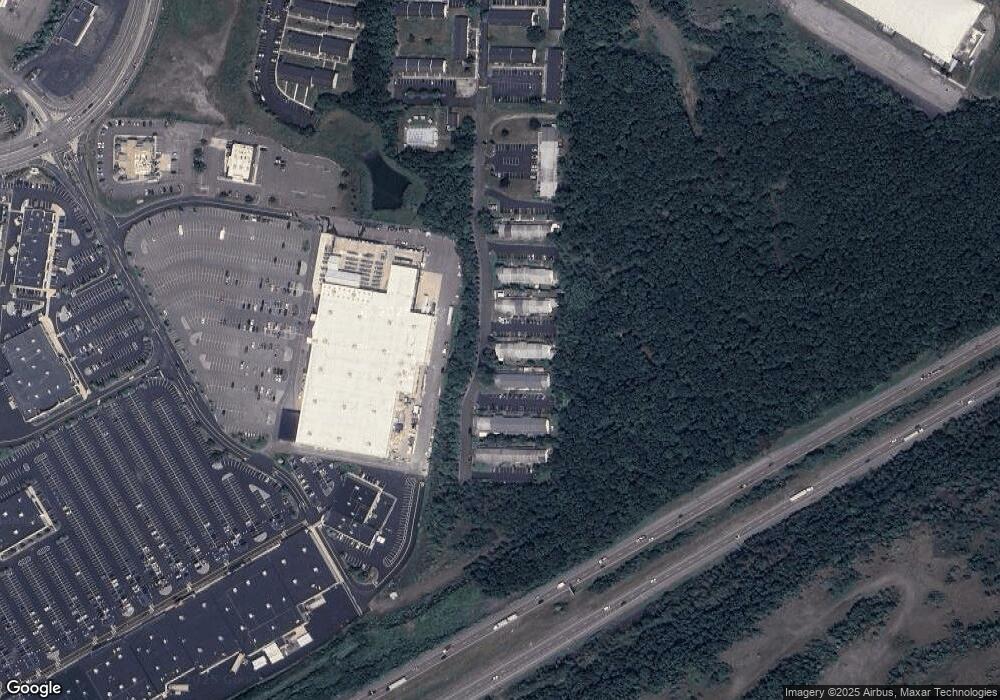
35 Trenton Ct Wilkes Barre, PA 18702
Estimated Value: $132,856 - $153,000
2
Beds
2
Baths
1,024
Sq Ft
$140/Sq Ft
Est. Value
About This Home
This home is located at 35 Trenton Ct, Wilkes Barre, PA 18702 and is currently estimated at $143,464, approximately $140 per square foot. 35 Trenton Ct is a home located in Luzerne County with nearby schools including Daniel J. Flood Elementary School, Solomon/Plains Junior High School, and Al Noor Islamic Academy.
Ownership History
Date
Name
Owned For
Owner Type
Purchase Details
Closed on
Oct 28, 2020
Sold by
Palmer Jason Richard and Palmer Valerie
Bought by
Winters Carmen
Current Estimated Value
Home Financials for this Owner
Home Financials are based on the most recent Mortgage that was taken out on this home.
Original Mortgage
$52,000
Outstanding Balance
$37,560
Interest Rate
2.8%
Mortgage Type
New Conventional
Estimated Equity
$105,904
Purchase Details
Closed on
Apr 5, 2016
Sold by
Palmer Valerie and Simmons Valerie
Bought by
Palmer Jason Richard and Palmer Valerie
Purchase Details
Closed on
Jun 17, 2011
Sold by
Sevison William F
Bought by
Simmons Valerie L
Purchase Details
Closed on
Jun 25, 2005
Sold by
Vidal Carlos and Chin Jenifer R
Bought by
Sevison William F
Home Financials for this Owner
Home Financials are based on the most recent Mortgage that was taken out on this home.
Original Mortgage
$52,584
Interest Rate
5.59%
Mortgage Type
FHA
Create a Home Valuation Report for This Property
The Home Valuation Report is an in-depth analysis detailing your home's value as well as a comparison with similar homes in the area
Home Values in the Area
Average Home Value in this Area
Purchase History
| Date | Buyer | Sale Price | Title Company |
|---|---|---|---|
| Winters Carmen | $65,000 | None Available | |
| Palmer Jason Richard | -- | None Available | |
| Simmons Valerie L | $58,000 | None Available | |
| Sevison William F | $53,000 | None Available |
Source: Public Records
Mortgage History
| Date | Status | Borrower | Loan Amount |
|---|---|---|---|
| Open | Winters Carmen | $52,000 | |
| Previous Owner | Sevison William F | $52,584 |
Source: Public Records
Tax History Compared to Growth
Tax History
| Year | Tax Paid | Tax Assessment Tax Assessment Total Assessment is a certain percentage of the fair market value that is determined by local assessors to be the total taxable value of land and additions on the property. | Land | Improvement |
|---|---|---|---|---|
| 2025 | $1,677 | $60,900 | $17,800 | $43,100 |
| 2024 | $1,677 | $60,900 | $17,800 | $43,100 |
| 2023 | $1,644 | $60,900 | $17,800 | $43,100 |
| 2022 | $1,596 | $60,900 | $17,800 | $43,100 |
| 2021 | $1,596 | $60,900 | $17,800 | $43,100 |
| 2020 | $1,596 | $60,900 | $17,800 | $43,100 |
| 2019 | $1,560 | $60,900 | $17,800 | $43,100 |
| 2018 | $1,524 | $60,900 | $17,800 | $43,100 |
| 2017 | $1,488 | $60,900 | $17,800 | $43,100 |
| 2016 | -- | $60,900 | $17,800 | $43,100 |
| 2015 | $1,330 | $60,900 | $17,800 | $43,100 |
| 2014 | $1,330 | $60,900 | $17,800 | $43,100 |
Source: Public Records
Map
Nearby Homes