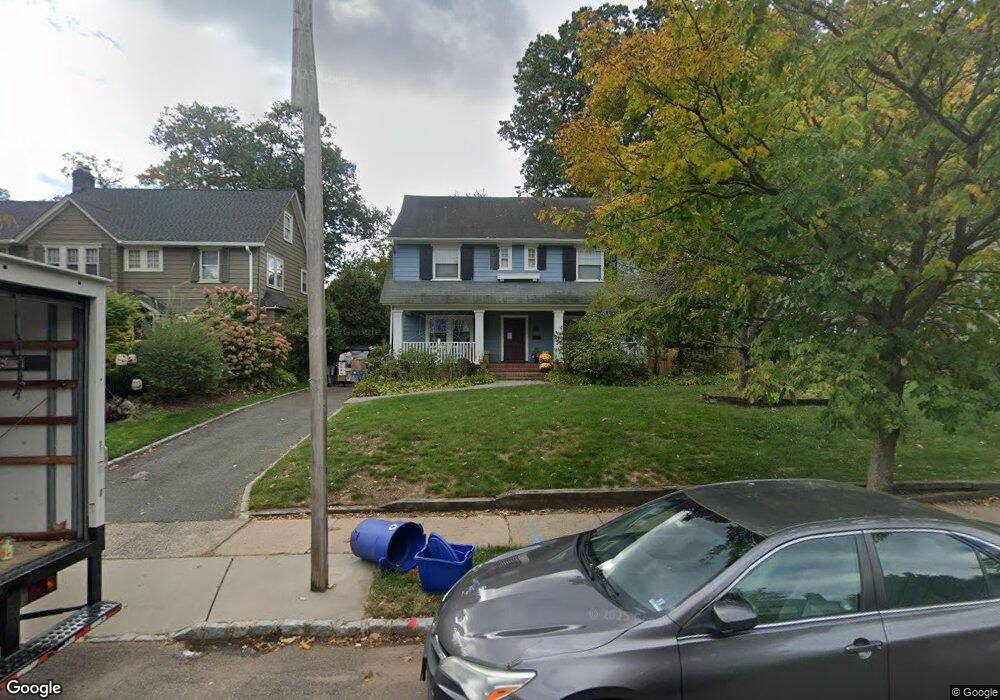
35 Tuxedo Rd Montclair, NJ 07042
Estimated Value: $1,683,000 - $1,923,000
--
Bed
--
Bath
2,962
Sq Ft
$600/Sq Ft
Est. Value
About This Home
This home is located at 35 Tuxedo Rd, Montclair, NJ 07042 and is currently estimated at $1,778,145, approximately $600 per square foot. 35 Tuxedo Rd is a home located in Essex County with nearby schools including Hillside School, Bradford School, and Charles H. Bullock School.
Ownership History
Date
Name
Owned For
Owner Type
Purchase Details
Closed on
Sep 8, 2011
Sold by
Lefkowitz Allen and Lefkowitz Vicki
Bought by
Borgen Christopher J and Borgen Lori Outzs
Current Estimated Value
Home Financials for this Owner
Home Financials are based on the most recent Mortgage that was taken out on this home.
Original Mortgage
$607,500
Outstanding Balance
$414,373
Interest Rate
4.33%
Mortgage Type
New Conventional
Estimated Equity
$1,363,772
Purchase Details
Closed on
Jun 3, 2008
Sold by
Gallt Robert H and Gallt Sandra H
Bought by
Lefkowitz Allen and Lefkowitz Vicki
Home Financials for this Owner
Home Financials are based on the most recent Mortgage that was taken out on this home.
Original Mortgage
$564,400
Interest Rate
6%
Mortgage Type
Purchase Money Mortgage
Create a Home Valuation Report for This Property
The Home Valuation Report is an in-depth analysis detailing your home's value as well as a comparison with similar homes in the area
Home Values in the Area
Average Home Value in this Area
Purchase History
| Date | Buyer | Sale Price | Title Company |
|---|---|---|---|
| Borgen Christopher J | $675,000 | Wfg National Title Ins Co | |
| Lefkowitz Allen | $705,500 | None Available |
Source: Public Records
Mortgage History
| Date | Status | Borrower | Loan Amount |
|---|---|---|---|
| Open | Borgen Christopher J | $607,500 | |
| Previous Owner | Lefkowitz Allen | $564,400 |
Source: Public Records
Tax History Compared to Growth
Tax History
| Year | Tax Paid | Tax Assessment Tax Assessment Total Assessment is a certain percentage of the fair market value that is determined by local assessors to be the total taxable value of land and additions on the property. | Land | Improvement |
|---|---|---|---|---|
| 2025 | $27,141 | $803,000 | $352,000 | $451,000 |
| 2024 | $27,141 | $803,000 | $352,000 | $451,000 |
| 2022 | $26,403 | $803,000 | $352,000 | $451,000 |
| 2021 | $25,945 | $803,000 | $352,000 | $451,000 |
| 2020 | $25,527 | $803,000 | $352,000 | $451,000 |
| 2019 | $25,262 | $803,000 | $352,000 | $451,000 |
| 2018 | $24,845 | $803,000 | $352,000 | $451,000 |
| 2017 | $25,014 | $669,900 | $302,900 | $367,000 |
| 2016 | $24,344 | $669,900 | $302,900 | $367,000 |
| 2015 | $23,621 | $669,900 | $302,900 | $367,000 |
| 2014 | $22,830 | $669,900 | $302,900 | $367,000 |
Source: Public Records
Map
Nearby Homes
- 58 Cambridge Rd
- 69 Christopher St
- 411 Ridgewood Ave
- 41 Glenridge Ave Unit 2L
- 41 Glenridge Ave Unit 2R
- 37 Montclair Ave
- 734 Broad St
- 715 Broad St
- 27 Grant St
- 76 Grove St Unit 4
- 76 Grove St
- 63 Greenwood Ave
- 80 Bay St Unit 8
- 226 Baldwin St
- 197 N Fullerton Ave
- 81 Clark Ave
- 48 N Willow St
- 81 N Fullerton Ave
- 183 Claremont Ave