Estimated Value: $482,000 - $546,000
4
Beds
2
Baths
1,872
Sq Ft
$269/Sq Ft
Est. Value
About This Home
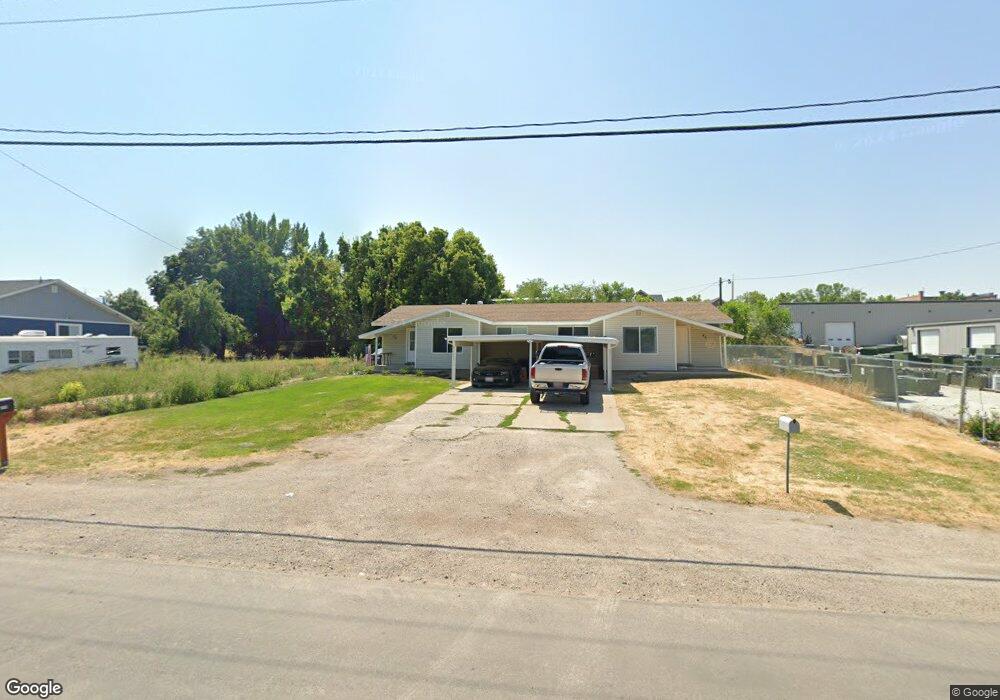
This home is located at 35 W 100 N, Hyrum, UT 84319 and is currently estimated at $503,359, approximately $268 per square foot. 35 W 100 N is a home located in Cache County with nearby schools including Lincoln School, South Cache Middle School, and Mountain Crest High School.
Ownership History
Date
Name
Owned For
Owner Type
Purchase Details
Closed on
Mar 11, 2024
Sold by
Nielson Tanner and Fuhriman Malorie
Bought by
Hyrum City
Current Estimated Value
Purchase Details
Closed on
Mar 4, 2022
Sold by
Tyson Smith
Bought by
Nielosn Tanner and Fuhriman Malorie
Home Financials for this Owner
Home Financials are based on the most recent Mortgage that was taken out on this home.
Original Mortgage
$382,936
Interest Rate
3.92%
Mortgage Type
FHA
Purchase Details
Closed on
Jun 26, 2019
Sold by
Bassett Teresa
Bought by
Smith Tyson
Purchase Details
Closed on
Aug 15, 2000
Sold by
Bassett Stanley C and George Calvin Bassett Inter Vi
Bought by
Bassett Teresa
Create a Home Valuation Report for This Property
The Home Valuation Report is an in-depth analysis detailing your home's value as well as a comparison with similar homes in the area
Home Values in the Area
Average Home Value in this Area
Purchase History
| Date | Buyer | Sale Price | Title Company |
|---|---|---|---|
| Hyrum City | -- | Cache Title | |
| Nielosn Tanner | -- | Pinnacle Title | |
| Smith Tyson | -- | Hickman Land Title Logan | |
| Bassett Teresa | -- | Hickman Land Title Co |
Source: Public Records
Mortgage History
| Date | Status | Borrower | Loan Amount |
|---|---|---|---|
| Previous Owner | Nielosn Tanner | $382,936 |
Source: Public Records
Tax History Compared to Growth
Tax History
| Year | Tax Paid | Tax Assessment Tax Assessment Total Assessment is a certain percentage of the fair market value that is determined by local assessors to be the total taxable value of land and additions on the property. | Land | Improvement |
|---|---|---|---|---|
| 2025 | $2,126 | $555,058 | $155,000 | $400,058 |
| 2024 | $2,027 | $494,233 | $155,000 | $339,233 |
| 2023 | $1,415 | $329,890 | $110,000 | $219,890 |
| 2022 | $1,477 | $329,890 | $110,000 | $219,890 |
| 2021 | $1,637 | $309,900 | $110,000 | $199,900 |
| 2020 | $1,161 | $206,300 | $75,000 | $131,300 |
| 2019 | $1,235 | $206,300 | $75,000 | $131,300 |
| 2018 | $1,012 | $163,424 | $40,000 | $123,424 |
| 2017 | $986 | $82,610 | $0 | $0 |
| 2016 | $1,008 | $82,610 | $0 | $0 |
| 2015 | $1,010 | $82,610 | $0 | $0 |
| 2014 | $898 | $75,105 | $0 | $0 |
| 2013 | -- | $75,105 | $0 | $0 |
Source: Public Records
Map
Nearby Homes