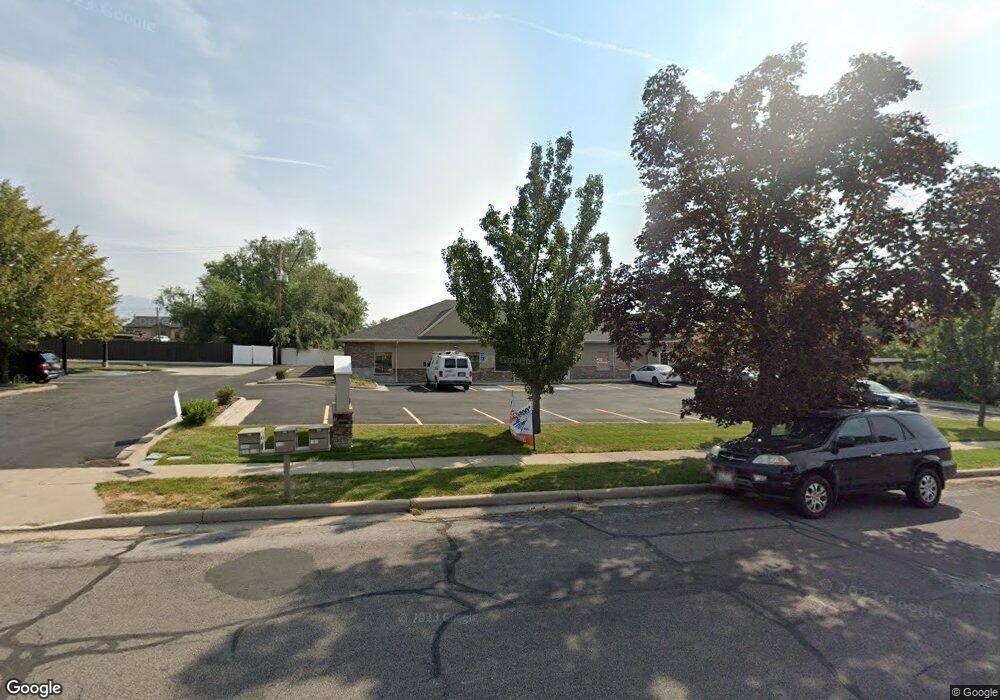
35 W 50 S Centerville, UT 84014
Studio
--
Bath
600
Sq Ft
21,344
Sq Ft
About This Home
This home is located at 35 W 50 S, Centerville, UT 84014. 35 W 50 S is a home located in Davis County with nearby schools including J A Taylor Elementary School, Centerville Jr High, and Viewmont High School.
Ownership History
Date
Name
Owned For
Owner Type
Purchase Details
Closed on
May 29, 2013
Sold by
Fc Associates Lp
Bought by
Iw Investments Llc
Home Financials for this Owner
Home Financials are based on the most recent Mortgage that was taken out on this home.
Original Mortgage
$420,000
Outstanding Balance
$295,467
Interest Rate
3.32%
Mortgage Type
Commercial
Purchase Details
Closed on
Aug 5, 2010
Sold by
Checketts Brent and Checketts Sheila
Bought by
Fc & Associates Lp
Purchase Details
Closed on
Dec 28, 2007
Sold by
Northwood Inc
Bought by
Federico Tony J and Federico Sharon C
Home Financials for this Owner
Home Financials are based on the most recent Mortgage that was taken out on this home.
Original Mortgage
$705,000
Interest Rate
6.05%
Mortgage Type
Commercial
Purchase Details
Closed on
May 23, 2007
Sold by
K & R Samco Llc
Bought by
Northwood Inc and Wilson Properties & Associates Lc
Create a Home Valuation Report for This Property
The Home Valuation Report is an in-depth analysis detailing your home's value as well as a comparison with similar homes in the area
Purchase History
| Date | Buyer | Sale Price | Title Company |
|---|---|---|---|
| Iw Investments Llc | -- | Mountain View Title & | |
| Iw Investments Llc | -- | Mountain View Title & | |
| Fc & Associates Lp | -- | Mountain View Title | |
| Fc & Associates Lp | -- | Mountain View Title | |
| Fc & Associates Lp | -- | Mountain View Title | |
| Fc & Associates Lp | -- | Mountain View Title | |
| Federico Tony J | -- | Bonneville Superior Title Co | |
| Federico Tony J | -- | Bonneville Superior Title Co | |
| Northwood Inc | -- | Bonneville Superior Title Co | |
| Northwood Inc | -- | Bonneville Superior Title Co |
Source: Public Records
Mortgage History
| Date | Status | Borrower | Loan Amount |
|---|---|---|---|
| Open | Iw Investments Llc | $420,000 | |
| Previous Owner | Federico Tony J | $705,000 |
Source: Public Records
Tax History
| Year | Tax Paid | Tax Assessment Tax Assessment Total Assessment is a certain percentage of the fair market value that is determined by local assessors to be the total taxable value of land and additions on the property. | Land | Improvement |
|---|---|---|---|---|
| 2025 | $11,195 | $1,070,862 | $391,022 | $679,840 |
| 2024 | $10,608 | $567,608 | $193,696 | $373,912 |
| 2023 | $10,343 | $550,000 | $176,088 | $373,912 |
| 2022 | $7,997 | $774,142 | $320,160 | $453,982 |
| 2021 | $8,293 | $687,800 | $233,818 | $453,982 |
| 2020 | $8,295 | $687,800 | $233,818 | $453,982 |
| 2019 | $8,081 | $654,423 | $233,818 | $420,605 |
| 2018 | $7,593 | $603,100 | $182,495 | $420,605 |
| 2016 | $6,860 | $603,100 | $182,495 | $420,605 |
| 2015 | $7,459 | $555,000 | $182,495 | $372,505 |
| 2014 | $7,112 | $555,000 | $182,495 | $372,505 |
| 2013 | -- | $555,000 | $182,495 | $372,505 |
Source: Public Records
Map
Nearby Homes
- 88 W 50 S Unit A4
- 88 W 50 S Unit C-3
- 88 W 50 S Unit B5
- 330 W Paradiso Ln
- 56 W 200 N
- 147 N 360 W Unit 21
- 360 E Center St
- 328 E 1100 S
- 324 S 600 W
- 287 S 680 W Unit 9
- 345 E 600 S
- 83 W 850 S
- 252 N 400 E
- 204 Lyman Ln
- 380 E 400 N
- 495 E 475 S
- 295 E 500 N
- 96 Village Square Rd
- 951 Centerville Commons Way
- 282 W 605 N Unit I
Your Personal Tour Guide
Ask me questions while you tour the home.