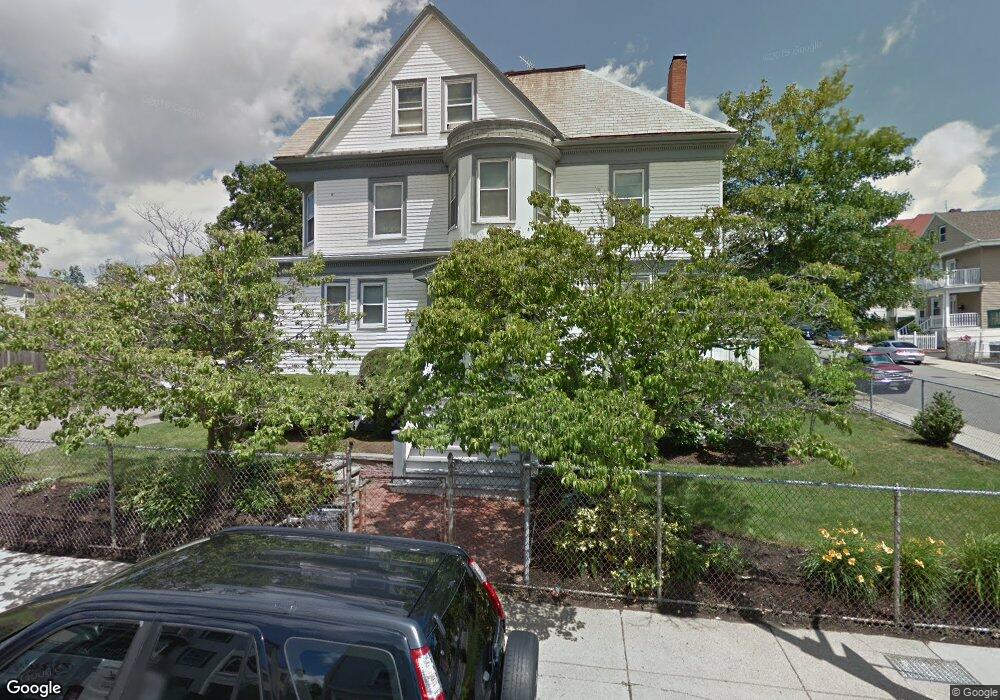
35 Wayland St Dorchester, MA 02125
Dudley-Brunswick King NeighborhoodEstimated Value: $1,006,289 - $1,082,000
5
Beds
4
Baths
3,895
Sq Ft
$269/Sq Ft
Est. Value
About This Home
This home is located at 35 Wayland St, Dorchester, MA 02125 and is currently estimated at $1,049,072, approximately $269 per square foot. 35 Wayland St is a home located in Suffolk County with nearby schools including Bridge Boston Charter School, Dudley Street Neighborhood Charter School, and Uncommon Schools Roxbury Prep Dorchester Campus.
Ownership History
Date
Name
Owned For
Owner Type
Purchase Details
Closed on
Oct 25, 2017
Sold by
Bullock Jonathan A
Bought by
Bullock Jonathan A and Bullock Richard L
Current Estimated Value
Purchase Details
Closed on
Mar 7, 2001
Sold by
Oliver Jennifer M
Bought by
Bullock Jennifer A
Home Financials for this Owner
Home Financials are based on the most recent Mortgage that was taken out on this home.
Original Mortgage
$187,775
Interest Rate
7.15%
Mortgage Type
Purchase Money Mortgage
Purchase Details
Closed on
Dec 13, 1988
Sold by
Caldwell Author L
Bought by
Bullock Jonathan A
Home Financials for this Owner
Home Financials are based on the most recent Mortgage that was taken out on this home.
Original Mortgage
$153,000
Interest Rate
10.17%
Mortgage Type
Purchase Money Mortgage
Create a Home Valuation Report for This Property
The Home Valuation Report is an in-depth analysis detailing your home's value as well as a comparison with similar homes in the area
Home Values in the Area
Average Home Value in this Area
Purchase History
| Date | Buyer | Sale Price | Title Company |
|---|---|---|---|
| Bullock Jonathan A | -- | -- | |
| Bullock Jennifer A | $3,000 | -- | |
| Bullock Jonathan A | $170,000 | -- |
Source: Public Records
Mortgage History
| Date | Status | Borrower | Loan Amount |
|---|---|---|---|
| Previous Owner | Bullock Jonathan A | $10,000 | |
| Previous Owner | Bullock Jonathan A | $187,775 | |
| Previous Owner | Bullock Jonathan A | $153,000 |
Source: Public Records
Tax History Compared to Growth
Tax History
| Year | Tax Paid | Tax Assessment Tax Assessment Total Assessment is a certain percentage of the fair market value that is determined by local assessors to be the total taxable value of land and additions on the property. | Land | Improvement |
|---|---|---|---|---|
| 2025 | $10,069 | $869,500 | $335,600 | $533,900 |
| 2024 | $9,006 | $826,200 | $334,200 | $492,000 |
| 2023 | $8,292 | $772,100 | $312,300 | $459,800 |
| 2022 | $7,503 | $689,600 | $278,900 | $410,700 |
| 2021 | $6,877 | $644,500 | $260,700 | $383,800 |
| 2020 | $6,152 | $582,600 | $253,300 | $329,300 |
| 2019 | $5,340 | $506,600 | $194,400 | $312,200 |
| 2018 | $4,826 | $460,500 | $194,400 | $266,100 |
| 2017 | $4,735 | $447,100 | $194,400 | $252,700 |
| 2016 | $4,918 | $447,100 | $194,400 | $252,700 |
| 2015 | $4,690 | $387,300 | $144,700 | $242,600 |
| 2014 | $4,429 | $352,100 | $144,700 | $207,400 |
Source: Public Records
Map
Nearby Homes
- 173 Magnolia St Unit 5
- 47 Sargent St Unit 3
- 175 Howard Ave Unit 2
- 96-98 Woodledge St
- 130 Howard Ave
- 18 Sargent St Unit B
- 163 Howard Ave
- 35 Dewey St Unit 35
- 252-254 Magnolia St
- 31 Dewey St
- 91 Howard Ave
- 52 Intervale St
- 108 Maywood St Unit 2
- 45 Brookford St
- 42 Monadnock St
- 352 Blue Hill Ave Unit 8
- 8 Adrian St
- 53 Woodford St
- 2 Otisfield St
- 36 Brookford St
- 63 Hartford St
- 47 Wayland St
- 23 Wayland St
- 14 Cunningham St
- 34 Wayland St Unit 3
- 34 Wayland St Unit 2
- 34 Wayland St Unit 1
- 34 Wayland St
- 26A Wayland St
- 55 Wayland St
- 55 Wayland St Unit B
- 55 Wayland St Unit 1
- 21 Wayland St
- 40 Wayland St
- 40 Wayland St Unit 3
- 40 Wayland St Unit 2-3
- 40 Wayland St Unit 1
- 42 Wayland St
- 16 Cunningham St
- 30 Wayland St