35 Wayside Rd Westborough, MA 01581
Estimated Value: $1,049,000 - $1,298,000
4
Beds
3
Baths
2,676
Sq Ft
$424/Sq Ft
Est. Value
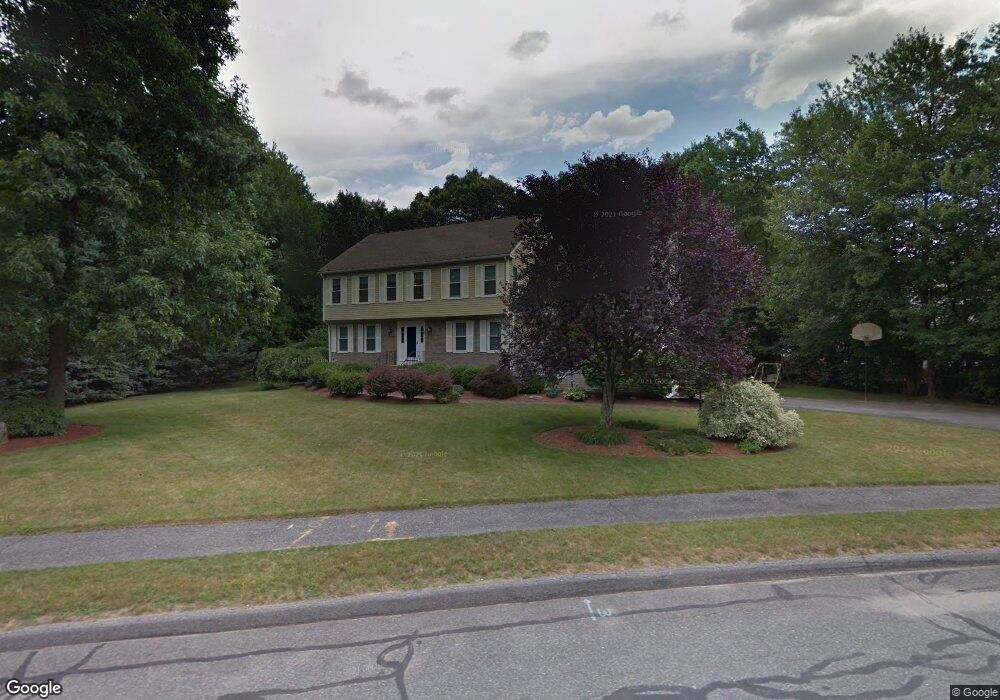
About This Home
This home is located at 35 Wayside Rd, Westborough, MA 01581 and is currently estimated at $1,135,081, approximately $424 per square foot. 35 Wayside Rd is a home located in Worcester County with nearby schools including Westborough High School, Ebridge Montessori School, and Westboro Knowledge Beginnings.
Ownership History
Date
Name
Owned For
Owner Type
Purchase Details
Closed on
Nov 30, 1995
Sold by
Lee Robert E and Lee Rosemary
Bought by
Becker Tobie S and Becker Robert J
Current Estimated Value
Purchase Details
Closed on
Jun 26, 1987
Sold by
Wayside Est Rlty Tr
Bought by
Lee Robert E
Create a Home Valuation Report for This Property
The Home Valuation Report is an in-depth analysis detailing your home's value as well as a comparison with similar homes in the area
Home Values in the Area
Average Home Value in this Area
Purchase History
| Date | Buyer | Sale Price | Title Company |
|---|---|---|---|
| Becker Tobie S | $319,000 | -- | |
| Lee Robert E | $339,900 | -- |
Source: Public Records
Mortgage History
| Date | Status | Borrower | Loan Amount |
|---|---|---|---|
| Open | Lee Robert E | $256,000 | |
| Closed | Lee Robert E | $256,000 |
Source: Public Records
Tax History
| Year | Tax Paid | Tax Assessment Tax Assessment Total Assessment is a certain percentage of the fair market value that is determined by local assessors to be the total taxable value of land and additions on the property. | Land | Improvement |
|---|---|---|---|---|
| 2025 | $14,288 | $877,100 | $357,200 | $519,900 |
| 2024 | $13,638 | $831,100 | $340,000 | $491,100 |
| 2023 | $12,948 | $768,900 | $321,000 | $447,900 |
| 2022 | $11,991 | $648,500 | $255,600 | $392,900 |
| 2021 | $11,830 | $638,100 | $245,200 | $392,900 |
| 2020 | $2,343 | $642,800 | $259,600 | $383,200 |
| 2019 | $2,253 | $606,100 | $255,500 | $350,600 |
| 2018 | $2,202 | $557,100 | $245,200 | $311,900 |
| 2017 | $9,916 | $557,100 | $245,200 | $311,900 |
| 2016 | $9,953 | $560,100 | $245,200 | $314,900 |
| 2015 | $9,438 | $507,700 | $216,600 | $291,100 |
Source: Public Records
Map
Nearby Homes
- 11 Quick Farm Rd
- 22 Capt Samuel Forbush Rd
- 192 W Main St
- 26 Mount Pleasant St
- 1 Benjamin Dr
- 60 Belknap St
- 146 Upton Rd
- 1 Elizabeth Dr
- 34 Harvey Ln
- LL39 Libbey Ln
- 37 Oneil Dr
- 46 Lackey St
- 48 Lackey St
- 57 Spring Rd
- 2 Libbey Ln
- 186 Spring St
- 44 South St
- 68 Spring St
- 4203 Peters Farm Way Unit 4203
- 4 Donna Pass
Your Personal Tour Guide
Ask me questions while you tour the home.