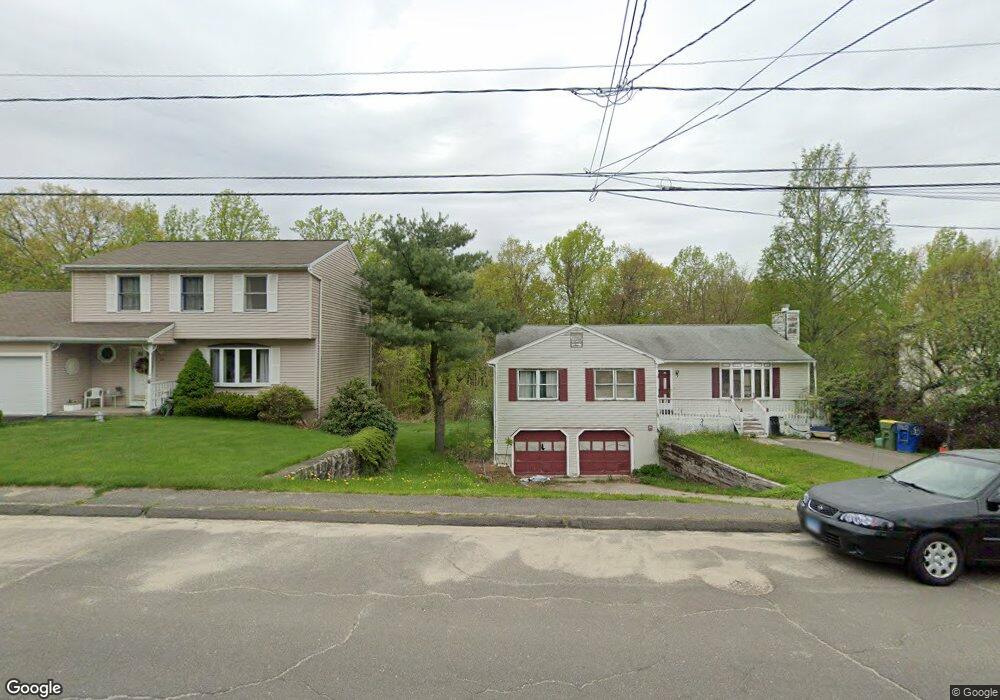
35 Westport Dr Waterbury, CT 06706
South End District NeighborhoodEstimated Value: $333,718 - $397,000
3
Beds
2
Baths
1,276
Sq Ft
$291/Sq Ft
Est. Value
About This Home
This home is located at 35 Westport Dr, Waterbury, CT 06706 and is currently estimated at $371,930, approximately $291 per square foot. 35 Westport Dr is a home located in New Haven County with nearby schools including Wendell L. Cross Elementary School, Michael F. Wallace Middle School, and Crosby High School.
Ownership History
Date
Name
Owned For
Owner Type
Purchase Details
Closed on
Apr 13, 2022
Sold by
Clement Wilson
Bought by
Schiffmiller Maureen
Current Estimated Value
Purchase Details
Closed on
Aug 30, 2011
Sold by
Barros Joseph and Barros Maria A
Bought by
Clement Wilson
Create a Home Valuation Report for This Property
The Home Valuation Report is an in-depth analysis detailing your home's value as well as a comparison with similar homes in the area
Home Values in the Area
Average Home Value in this Area
Purchase History
| Date | Buyer | Sale Price | Title Company |
|---|---|---|---|
| Schiffmiller Maureen | -- | None Available | |
| Clement Wilson | $145,000 | -- |
Source: Public Records
Mortgage History
| Date | Status | Borrower | Loan Amount |
|---|---|---|---|
| Previous Owner | Clement Wilson | $85,242 | |
| Previous Owner | Clement Wilson | $60,000 |
Source: Public Records
Tax History Compared to Growth
Tax History
| Year | Tax Paid | Tax Assessment Tax Assessment Total Assessment is a certain percentage of the fair market value that is determined by local assessors to be the total taxable value of land and additions on the property. | Land | Improvement |
|---|---|---|---|---|
| 2025 | $7,582 | $168,560 | $22,540 | $146,020 |
| 2024 | $8,334 | $168,560 | $22,540 | $146,020 |
| 2023 | $9,134 | $168,560 | $22,540 | $146,020 |
| 2022 | $5,220 | $86,700 | $22,540 | $64,160 |
| 2021 | $5,220 | $86,700 | $22,540 | $64,160 |
| 2020 | $5,220 | $86,700 | $22,540 | $64,160 |
| 2019 | $5,220 | $86,700 | $22,540 | $64,160 |
| 2018 | $5,220 | $86,700 | $22,540 | $64,160 |
| 2017 | $6,072 | $100,840 | $22,540 | $78,300 |
| 2016 | $6,072 | $100,840 | $22,540 | $78,300 |
| 2015 | $5,871 | $100,840 | $22,540 | $78,300 |
| 2014 | $5,871 | $100,840 | $22,540 | $78,300 |
Source: Public Records
Map
Nearby Homes
- 147 Sprucedale Dr
- 185 Eastside Blvd
- 178 Peach Orchard Rd
- 44 Shadybrook Ln
- 89 Rockledge Dr
- 562 Piedmont St
- 60 Gayfield Rd
- 463 Pearl Lake Rd
- 335 Raymond St
- 51 Clover St
- 439 Piedmont St
- 00 Milton Ave
- 0372 Floyd St
- 41L Floyd St
- 0039 Floyd St
- 171 Kelsey St
- 73 Cornelius Ave
- 140 Edgewood Ave
- 4 Florence Dr
- 65 Clark Hill Rd
- 41 Westport Dr
- 38 Westport Dr
- 29 Westport Dr
- 44 Westport Dr
- 32 Westport Dr
- 45 Westport Dr
- 23 Westport Dr
- 26 Westport Dr
- 48 Westport Dr
- 110 Sprucedale Dr
- 104 Sprucedale Dr
- 20 Westport Dr
- 51 Westport Dr
- 17 Westport Dr
- 118 Sprucedale Dr
- 130 Sprucedale Dr
- 54 Westport Dr
- 96 Sprucedale Dr
- 109 Sprucedale Dr
- 14 Westport Dr