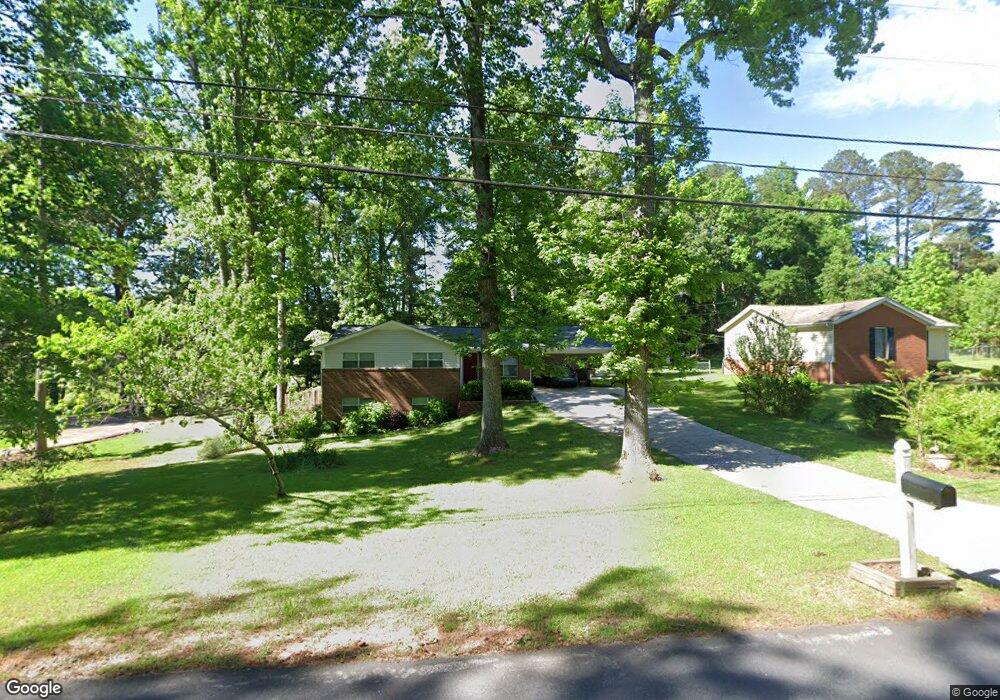
35 Windsor Rd Newnan, GA 30263
Estimated Value: $264,457 - $292,000
3
Beds
2
Baths
1,364
Sq Ft
$204/Sq Ft
Est. Value
About This Home
This home is located at 35 Windsor Rd, Newnan, GA 30263 and is currently estimated at $277,614, approximately $203 per square foot. 35 Windsor Rd is a home located in Coweta County with nearby schools including Northside Elementary School, Evans Middle School, and Newnan High School.
Ownership History
Date
Name
Owned For
Owner Type
Purchase Details
Closed on
Dec 20, 2023
Sold by
Waller Kenneth Wayne
Bought by
Waldrop Tamara
Current Estimated Value
Purchase Details
Closed on
Dec 12, 2023
Sold by
Sells James O
Bought by
Bright Bradley
Purchase Details
Closed on
Sep 27, 2016
Sold by
Homesouth Properties Llc
Bought by
Head Joseph and Head Brenda
Home Financials for this Owner
Home Financials are based on the most recent Mortgage that was taken out on this home.
Original Mortgage
$94,500
Interest Rate
3.46%
Mortgage Type
New Conventional
Purchase Details
Closed on
Jan 24, 2007
Sold by
Head Joseph Allen and Head Dianne Head
Bought by
Homesouth Properties Llc
Purchase Details
Closed on
Nov 22, 2004
Sold by
Todd Denson E
Bought by
Head Joseph A and Head Dianne
Purchase Details
Closed on
Nov 30, 1989
Bought by
Todd Denson E and Todd Kath
Create a Home Valuation Report for This Property
The Home Valuation Report is an in-depth analysis detailing your home's value as well as a comparison with similar homes in the area
Home Values in the Area
Average Home Value in this Area
Purchase History
| Date | Buyer | Sale Price | Title Company |
|---|---|---|---|
| Waldrop Tamara | -- | -- | |
| Bright Bradley | $235,000 | -- | |
| Head Joseph | -- | -- | |
| Homesouth Properties Llc | -- | -- | |
| Head Joseph A | $100,000 | -- | |
| Todd Denson E | -- | -- |
Source: Public Records
Mortgage History
| Date | Status | Borrower | Loan Amount |
|---|---|---|---|
| Previous Owner | Head Joseph | $94,500 |
Source: Public Records
Tax History Compared to Growth
Tax History
| Year | Tax Paid | Tax Assessment Tax Assessment Total Assessment is a certain percentage of the fair market value that is determined by local assessors to be the total taxable value of land and additions on the property. | Land | Improvement |
|---|---|---|---|---|
| 2024 | $1,961 | $84,470 | $20,000 | $64,470 |
| 2023 | $1,961 | $80,752 | $16,000 | $64,752 |
| 2022 | $1,779 | $72,223 | $16,000 | $56,223 |
| 2021 | $1,404 | $53,317 | $10,000 | $43,317 |
| 2020 | $1,413 | $53,317 | $10,000 | $43,317 |
| 2019 | $1,569 | $53,590 | $12,000 | $41,590 |
| 2018 | $1,571 | $53,590 | $12,000 | $41,590 |
| 2017 | $1,227 | $41,874 | $9,600 | $32,274 |
| 2016 | $1,087 | $37,549 | $9,600 | $27,949 |
| 2015 | $1,031 | $36,218 | $9,600 | $26,618 |
| 2014 | $976 | $34,554 | $9,600 | $24,954 |
Source: Public Records
Map
Nearby Homes
- 97 Windsor Ct
- 12 Windsor Way
- 19 Foster Dr
- 86 Lancaster Way
- 0 Lakewood Dr Unit 10554345
- 50 Shamrock Way
- 766 Country Club Rd
- 561 Witcher Rd
- 1965 Roscoe Rd
- 0 Witcher Rd Unit 14.23+/- AC 10524234
- 1985 Roscoe Rd
- 5 Gibson Rd
- 659 Country Club Rd
- 6 Little John Way
- 100 Redwine Dr
- LOT 196 Northshore at Redwine Dr
- LOT 199 Northshore at Redwine Dr
- 43 Warner Dr
- 1242 Witcher Rd
- 8 Canterbury Dr
- 33 Windsor Rd
- 37 Windsor Rd
- 0 Windsor Rd Unit 8661639
- 0 Windsor Rd Unit 8798607
- 0 Windsor Rd Unit 3254709
- 0 Windsor Rd Unit 3285139
- 0 Windsor Rd Unit 7042789
- 0 Windsor Rd Unit 7589861
- 0 Windsor Rd Unit 8066846
- 31 Windsor Rd
- 6 Holly Way Unit 1
- 36 Windsor Rd
- 34 Windsor Rd
- 29 Windsor Rd
- 38 Windsor Rd
- 30 Windsor Rd
- 2 Holly Way
- 4 Hammock Way
- 5 Holly Way
- 5 Holly Way Unit 8+/- Acres