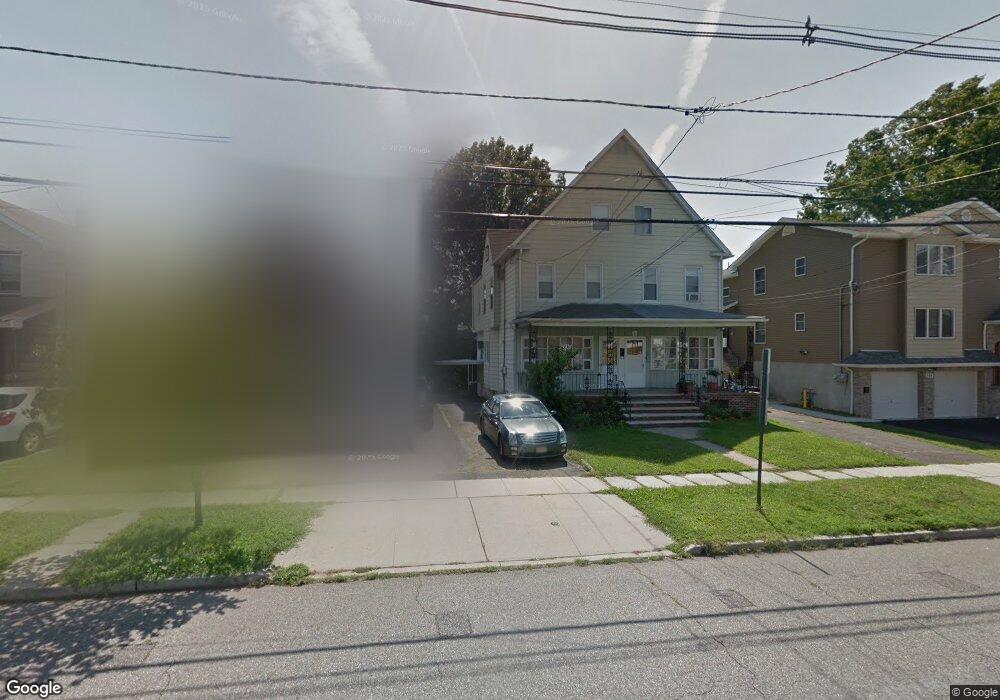
350 2nd Ave Unit Left Lyndhurst, NJ 07071
Estimated Value: $558,000 - $681,000
3
Beds
2
Baths
1,541
Sq Ft
$386/Sq Ft
Est. Value
About This Home
This home is located at 350 2nd Ave Unit Left, Lyndhurst, NJ 07071 and is currently estimated at $594,229, approximately $385 per square foot. 350 2nd Ave Unit Left is a home located in Bergen County with nearby schools including Lyndhurst High School and Sacred Heart School.
Ownership History
Date
Name
Owned For
Owner Type
Purchase Details
Closed on
Jun 3, 2003
Sold by
Nelson Martin
Bought by
Soh Chee Yong
Current Estimated Value
Purchase Details
Closed on
Jul 1, 1994
Sold by
Benenati Vincent
Bought by
Martin Nelson Martin and Martin Guadulupe
Home Financials for this Owner
Home Financials are based on the most recent Mortgage that was taken out on this home.
Original Mortgage
$124,000
Interest Rate
8.51%
Create a Home Valuation Report for This Property
The Home Valuation Report is an in-depth analysis detailing your home's value as well as a comparison with similar homes in the area
Home Values in the Area
Average Home Value in this Area
Purchase History
| Date | Buyer | Sale Price | Title Company |
|---|---|---|---|
| Soh Chee Yong | $260,000 | -- | |
| Martin Nelson Martin | $155,000 | -- |
Source: Public Records
Mortgage History
| Date | Status | Borrower | Loan Amount |
|---|---|---|---|
| Previous Owner | Martin Nelson Martin | $124,000 |
Source: Public Records
Tax History Compared to Growth
Tax History
| Year | Tax Paid | Tax Assessment Tax Assessment Total Assessment is a certain percentage of the fair market value that is determined by local assessors to be the total taxable value of land and additions on the property. | Land | Improvement |
|---|---|---|---|---|
| 2025 | $7,929 | $385,000 | $199,800 | $185,200 |
| 2024 | $7,642 | $380,100 | $197,000 | $183,100 |
| 2023 | $7,191 | $376,100 | $195,100 | $181,000 |
| 2022 | $7,191 | $226,700 | $135,900 | $90,800 |
| 2021 | $6,892 | $226,700 | $135,900 | $90,800 |
| 2020 | $6,742 | $226,700 | $135,900 | $90,800 |
| 2019 | $6,692 | $226,700 | $135,900 | $90,800 |
| 2018 | $6,747 | $226,700 | $135,900 | $90,800 |
| 2017 | $6,577 | $226,700 | $135,900 | $90,800 |
| 2016 | $6,429 | $226,700 | $135,900 | $90,800 |
| 2015 | $6,227 | $226,700 | $135,900 | $90,800 |
| 2014 | $6,146 | $226,700 | $135,900 | $90,800 |
Source: Public Records
Map
Nearby Homes