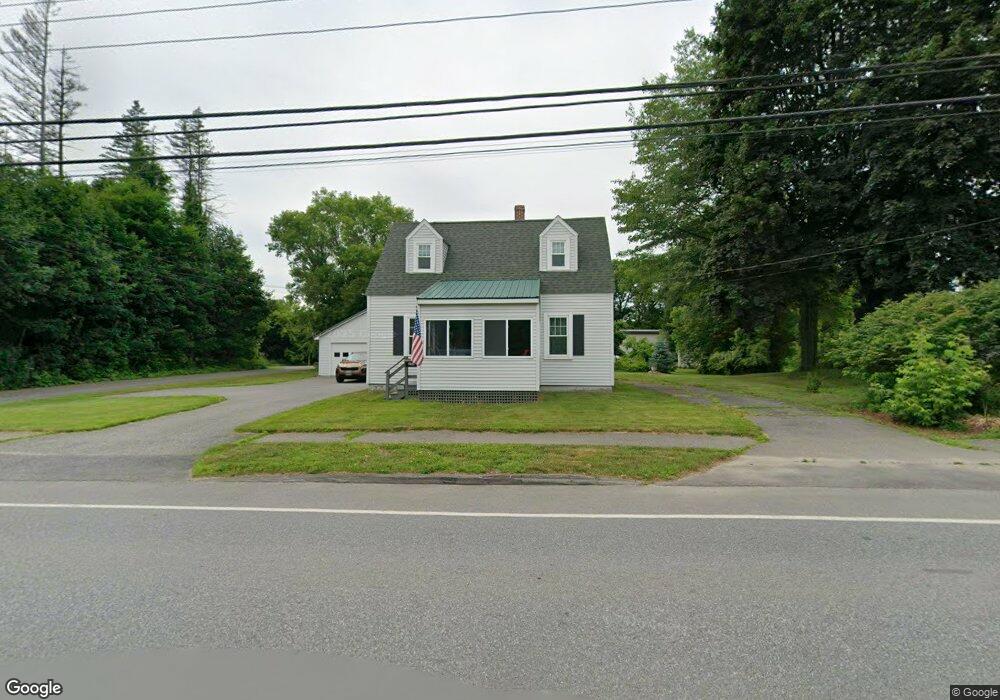
350 Benton Ave Winslow, ME 04901
Estimated Value: $226,000 - $244,000
2
Beds
1
Bath
1,078
Sq Ft
$218/Sq Ft
Est. Value
About This Home
This home is located at 350 Benton Ave, Winslow, ME 04901 and is currently estimated at $234,962, approximately $217 per square foot. 350 Benton Ave is a home located in Kennebec County with nearby schools including Winslow Elementary School, Winslow Junior High School, and Winslow High School.
Ownership History
Date
Name
Owned For
Owner Type
Purchase Details
Closed on
Jun 22, 2005
Sold by
Kennebec River Dev Pk Llc
Bought by
Ouellette George E
Current Estimated Value
Home Financials for this Owner
Home Financials are based on the most recent Mortgage that was taken out on this home.
Original Mortgage
$72,105
Outstanding Balance
$37,788
Interest Rate
5.82%
Mortgage Type
Purchase Money Mortgage
Estimated Equity
$197,174
Create a Home Valuation Report for This Property
The Home Valuation Report is an in-depth analysis detailing your home's value as well as a comparison with similar homes in the area
Home Values in the Area
Average Home Value in this Area
Purchase History
| Date | Buyer | Sale Price | Title Company |
|---|---|---|---|
| Ouellette George E | -- | -- | |
| Ouellette George E | -- | -- |
Source: Public Records
Mortgage History
| Date | Status | Borrower | Loan Amount |
|---|---|---|---|
| Open | Ouellette George E | $72,105 | |
| Closed | Ouellette George E | $72,105 |
Source: Public Records
Tax History Compared to Growth
Tax History
| Year | Tax Paid | Tax Assessment Tax Assessment Total Assessment is a certain percentage of the fair market value that is determined by local assessors to be the total taxable value of land and additions on the property. | Land | Improvement |
|---|---|---|---|---|
| 2024 | $2,841 | $189,400 | $20,100 | $169,300 |
| 2023 | $2,841 | $189,400 | $20,100 | $169,300 |
| 2022 | $2,001 | $94,400 | $17,200 | $77,200 |
| 2021 | $1,963 | $97,200 | $17,200 | $80,000 |
| 2020 | $1,829 | $97,200 | $17,200 | $80,000 |
| 2019 | $1,812 | $97,200 | $17,200 | $80,000 |
| 2018 | $1,385 | $97,200 | $17,200 | $80,000 |
| 2017 | $5,831 | $94,300 | $17,200 | $77,100 |
| 2016 | $1,289 | $81,900 | $17,200 | $64,700 |
| 2015 | $1,269 | $81,900 | $17,200 | $64,700 |
| 2014 | $1,269 | $81,900 | $17,200 | $64,700 |
Source: Public Records
Map
Nearby Homes
- 21 Cardinal Way
- 5 2nd St
- 2 Whippoorwill Dr Unit 35
- 5 Chickadee Trail Unit 5
- 24 Meadow View Ln
- 8 High St
- 6 Linden St
- 139 College Ave
- 670 Benton Ave Unit 8
- 11 College Ave
- 10 Leighton St
- 144 College Ave
- 44 High St
- 267 Main St
- Lot 4 Peachtree Ln
- 17 Hapworth Ln
- 145-147 Main St
- 51 Drummond Ave
- 162 College Ave
- 90 Elm St